Lumbee vs Lithuanian Median Household Income
COMPARE
Lumbee
Lithuanian
Median Household Income
Median Household Income Comparison
Lumbee
Lithuanians
$54,644
MEDIAN HOUSEHOLD INCOME
0.0/ 100
METRIC RATING
347th/ 347
METRIC RANK
$93,852
MEDIAN HOUSEHOLD INCOME
99.6/ 100
METRIC RATING
72nd/ 347
METRIC RANK
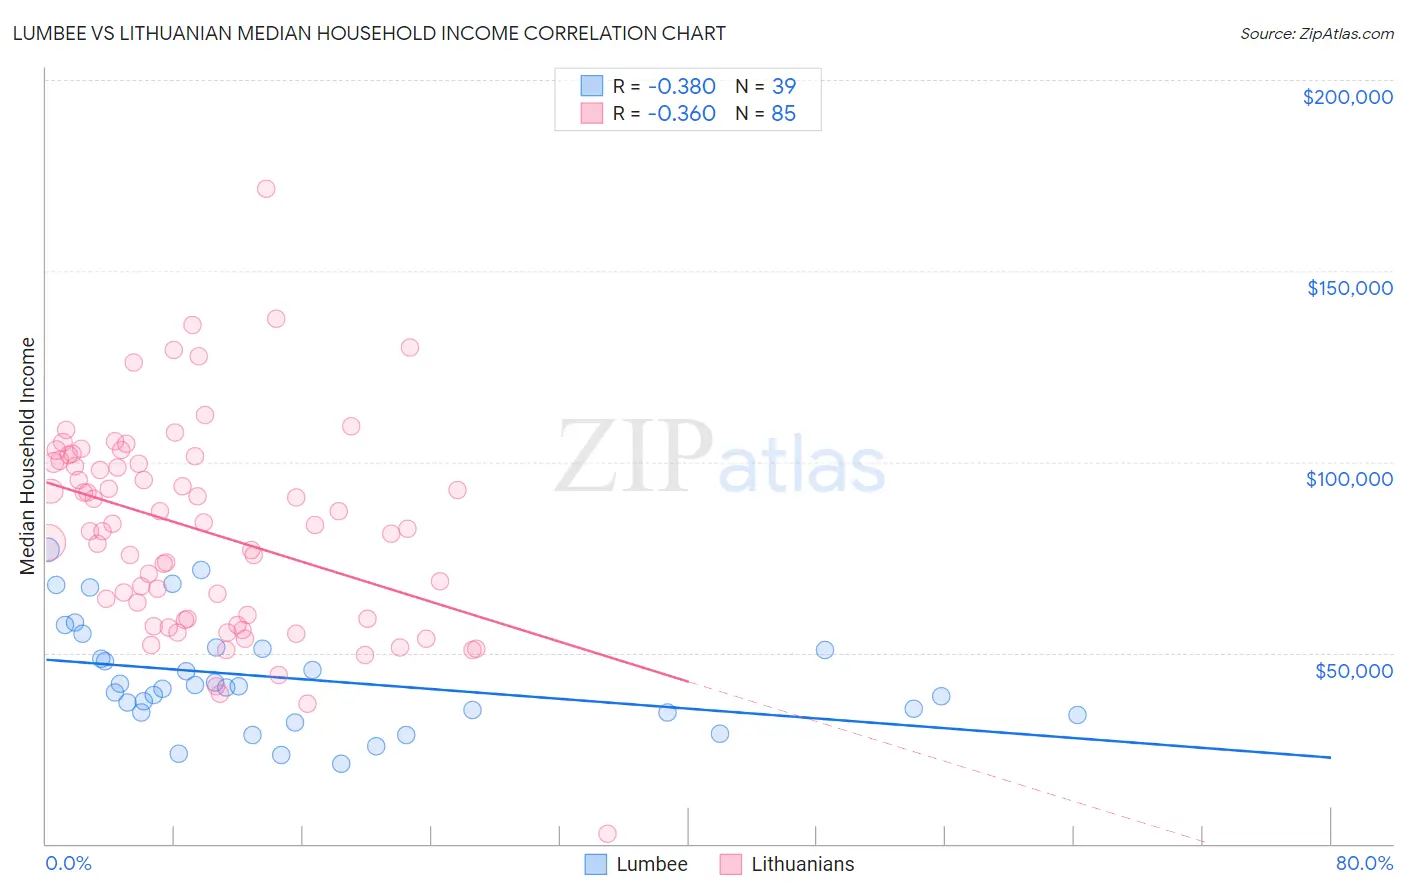
Lumbee vs Lithuanian Median Household Income Correlation Chart
The statistical analysis conducted on geographies consisting of 92,249,872 people shows a mild negative correlation between the proportion of Lumbee and median household income in the United States with a correlation coefficient (R) of -0.380 and weighted average of $54,644. Similarly, the statistical analysis conducted on geographies consisting of 421,640,790 people shows a mild negative correlation between the proportion of Lithuanians and median household income in the United States with a correlation coefficient (R) of -0.360 and weighted average of $93,852, a difference of 71.8%.
Median Household Income Correlation Summary
| Measurement | Lumbee | Lithuanian |
| Minimum | $20,917 | $2,499 |
| Maximum | $76,919 | $171,528 |
| Range | $56,002 | $169,029 |
| Mean | $43,208 | $81,905 |
| Median | $40,857 | $82,500 |
| Interquartile 25% (IQ1) | $34,279 | $58,701 |
| Interquartile 75% (IQ3) | $51,174 | $100,159 |
| Interquartile Range (IQR) | $16,895 | $41,458 |
| Standard Deviation (Sample) | $13,998 | $27,290 |
| Standard Deviation (Population) | $13,817 | $27,129 |
Similar Demographics by Median Household Income
Demographics Similar to Lumbee by Median Household Income
In terms of median household income, the demographic groups most similar to Lumbee are Navajo ($59,159, a difference of 8.3%), Puerto Rican ($59,197, a difference of 8.3%), Tohono O'odham ($61,663, a difference of 12.8%), Houma ($62,575, a difference of 14.5%), and Pima ($63,262, a difference of 15.8%).
| Demographics | Rating | Rank | Median Household Income |
| Creek | 0.0 /100 | #333 | Tragic $67,715 |
| Blacks/African Americans | 0.0 /100 | #334 | Tragic $67,573 |
| Cheyenne | 0.0 /100 | #335 | Tragic $66,974 |
| Immigrants | Congo | 0.0 /100 | #336 | Tragic $66,768 |
| Kiowa | 0.0 /100 | #337 | Tragic $65,914 |
| Immigrants | Yemen | 0.0 /100 | #338 | Tragic $65,194 |
| Hopi | 0.0 /100 | #339 | Tragic $65,043 |
| Pueblo | 0.0 /100 | #340 | Tragic $64,692 |
| Crow | 0.0 /100 | #341 | Tragic $63,681 |
| Pima | 0.0 /100 | #342 | Tragic $63,262 |
| Houma | 0.0 /100 | #343 | Tragic $62,575 |
| Tohono O'odham | 0.0 /100 | #344 | Tragic $61,663 |
| Puerto Ricans | 0.0 /100 | #345 | Tragic $59,197 |
| Navajo | 0.0 /100 | #346 | Tragic $59,159 |
| Lumbee | 0.0 /100 | #347 | Tragic $54,644 |
Demographics Similar to Lithuanians by Median Household Income
In terms of median household income, the demographic groups most similar to Lithuanians are Immigrants from Philippines ($93,899, a difference of 0.050%), Immigrants from Fiji ($93,933, a difference of 0.090%), Argentinean ($93,960, a difference of 0.11%), Mongolian ($93,971, a difference of 0.13%), and Immigrants from Egypt ($93,700, a difference of 0.16%).
| Demographics | Rating | Rank | Median Household Income |
| Immigrants | Belarus | 99.7 /100 | #65 | Exceptional $94,399 |
| Immigrants | Romania | 99.7 /100 | #66 | Exceptional $94,222 |
| Immigrants | Scotland | 99.7 /100 | #67 | Exceptional $94,091 |
| Mongolians | 99.7 /100 | #68 | Exceptional $93,971 |
| Argentineans | 99.7 /100 | #69 | Exceptional $93,960 |
| Immigrants | Fiji | 99.7 /100 | #70 | Exceptional $93,933 |
| Immigrants | Philippines | 99.6 /100 | #71 | Exceptional $93,899 |
| Lithuanians | 99.6 /100 | #72 | Exceptional $93,852 |
| Immigrants | Egypt | 99.6 /100 | #73 | Exceptional $93,700 |
| Immigrants | Latvia | 99.6 /100 | #74 | Exceptional $93,602 |
| Immigrants | Italy | 99.5 /100 | #75 | Exceptional $93,465 |
| South Africans | 99.5 /100 | #76 | Exceptional $93,379 |
| Immigrants | Afghanistan | 99.5 /100 | #77 | Exceptional $93,375 |
| Immigrants | Bulgaria | 99.4 /100 | #78 | Exceptional $93,148 |
| Sri Lankans | 99.4 /100 | #79 | Exceptional $93,093 |