Lumbee vs Alsatian Median Household Income
COMPARE
Lumbee
Alsatian
Median Household Income
Median Household Income Comparison
Lumbee
Alsatians
$54,644
MEDIAN HOUSEHOLD INCOME
0.0/ 100
METRIC RATING
347th/ 347
METRIC RANK
$85,053
MEDIAN HOUSEHOLD INCOME
49.2/ 100
METRIC RATING
176th/ 347
METRIC RANK
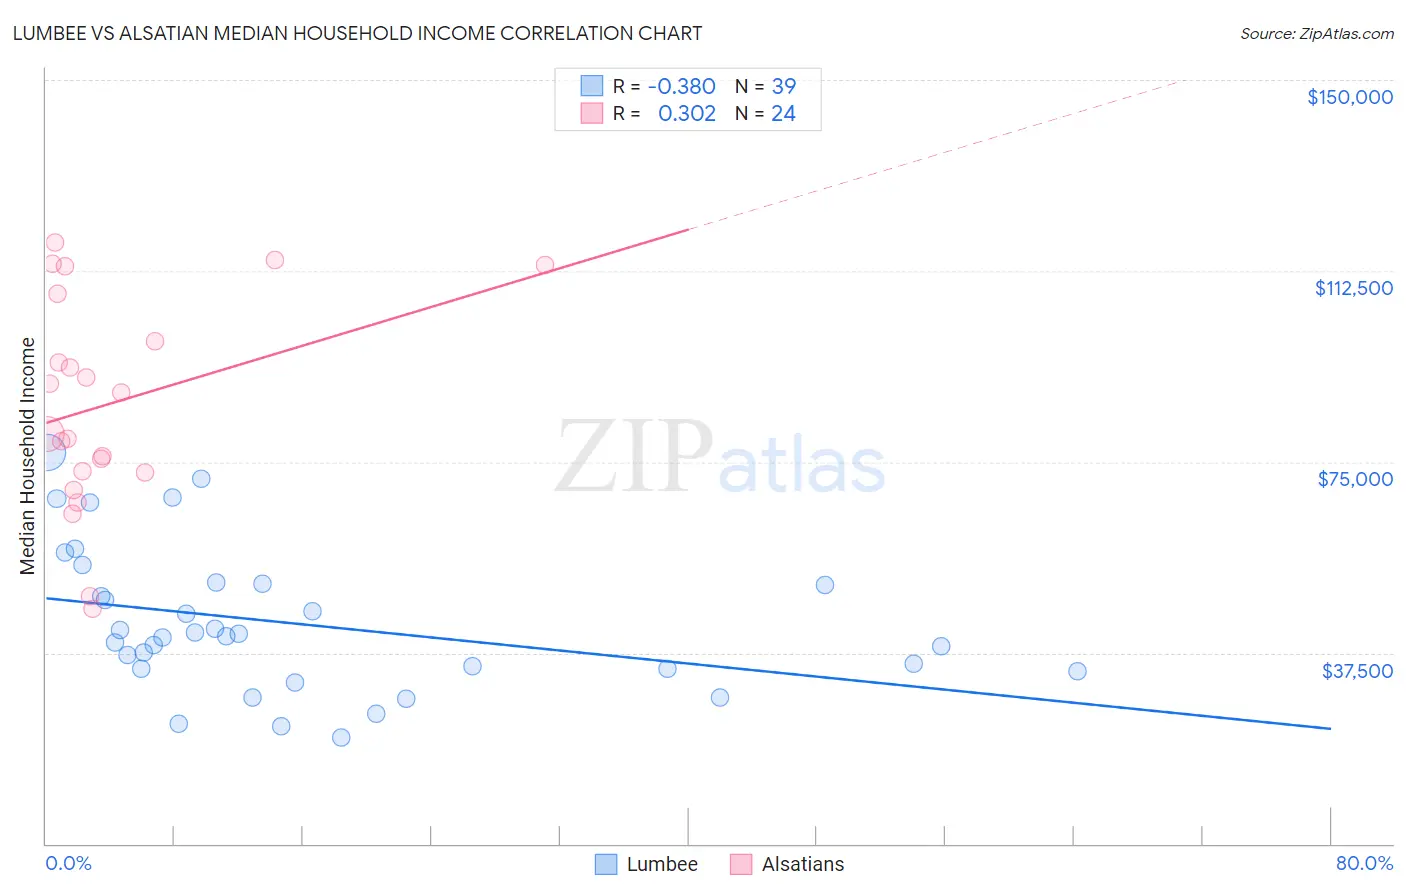
Lumbee vs Alsatian Median Household Income Correlation Chart
The statistical analysis conducted on geographies consisting of 92,249,872 people shows a mild negative correlation between the proportion of Lumbee and median household income in the United States with a correlation coefficient (R) of -0.380 and weighted average of $54,644. Similarly, the statistical analysis conducted on geographies consisting of 82,678,631 people shows a mild positive correlation between the proportion of Alsatians and median household income in the United States with a correlation coefficient (R) of 0.302 and weighted average of $85,053, a difference of 55.6%.
Median Household Income Correlation Summary
| Measurement | Lumbee | Alsatian |
| Minimum | $20,917 | $46,250 |
| Maximum | $76,919 | $118,135 |
| Range | $56,002 | $71,885 |
| Mean | $43,208 | $86,339 |
| Median | $40,857 | $84,486 |
| Interquartile 25% (IQ1) | $34,279 | $73,000 |
| Interquartile 75% (IQ3) | $51,174 | $103,435 |
| Interquartile Range (IQR) | $16,895 | $30,436 |
| Standard Deviation (Sample) | $13,998 | $20,538 |
| Standard Deviation (Population) | $13,817 | $20,105 |
Similar Demographics by Median Household Income
Demographics Similar to Lumbee by Median Household Income
In terms of median household income, the demographic groups most similar to Lumbee are Navajo ($59,159, a difference of 8.3%), Puerto Rican ($59,197, a difference of 8.3%), Tohono O'odham ($61,663, a difference of 12.8%), Houma ($62,575, a difference of 14.5%), and Pima ($63,262, a difference of 15.8%).
| Demographics | Rating | Rank | Median Household Income |
| Creek | 0.0 /100 | #333 | Tragic $67,715 |
| Blacks/African Americans | 0.0 /100 | #334 | Tragic $67,573 |
| Cheyenne | 0.0 /100 | #335 | Tragic $66,974 |
| Immigrants | Congo | 0.0 /100 | #336 | Tragic $66,768 |
| Kiowa | 0.0 /100 | #337 | Tragic $65,914 |
| Immigrants | Yemen | 0.0 /100 | #338 | Tragic $65,194 |
| Hopi | 0.0 /100 | #339 | Tragic $65,043 |
| Pueblo | 0.0 /100 | #340 | Tragic $64,692 |
| Crow | 0.0 /100 | #341 | Tragic $63,681 |
| Pima | 0.0 /100 | #342 | Tragic $63,262 |
| Houma | 0.0 /100 | #343 | Tragic $62,575 |
| Tohono O'odham | 0.0 /100 | #344 | Tragic $61,663 |
| Puerto Ricans | 0.0 /100 | #345 | Tragic $59,197 |
| Navajo | 0.0 /100 | #346 | Tragic $59,159 |
| Lumbee | 0.0 /100 | #347 | Tragic $54,644 |
Demographics Similar to Alsatians by Median Household Income
In terms of median household income, the demographic groups most similar to Alsatians are Immigrants from Costa Rica ($85,054, a difference of 0.0%), Immigrants from Eritrea ($85,025, a difference of 0.030%), Scottish ($85,101, a difference of 0.060%), Czechoslovakian ($84,965, a difference of 0.10%), and English ($84,915, a difference of 0.16%).
| Demographics | Rating | Rank | Median Household Income |
| Colombians | 59.7 /100 | #169 | Average $85,716 |
| Swiss | 59.2 /100 | #170 | Average $85,681 |
| Immigrants | South America | 58.1 /100 | #171 | Average $85,611 |
| Slovenes | 57.4 /100 | #172 | Average $85,562 |
| Immigrants | Cameroon | 53.4 /100 | #173 | Average $85,314 |
| Scottish | 50.0 /100 | #174 | Average $85,101 |
| Immigrants | Costa Rica | 49.2 /100 | #175 | Average $85,054 |
| Alsatians | 49.2 /100 | #176 | Average $85,053 |
| Immigrants | Eritrea | 48.8 /100 | #177 | Average $85,025 |
| Czechoslovakians | 47.8 /100 | #178 | Average $84,965 |
| English | 47.0 /100 | #179 | Average $84,915 |
| Immigrants | Portugal | 44.2 /100 | #180 | Average $84,740 |
| Hawaiians | 44.1 /100 | #181 | Average $84,729 |
| Uruguayans | 43.5 /100 | #182 | Average $84,691 |
| Spaniards | 42.7 /100 | #183 | Average $84,644 |