Lumbee vs British West Indian 12th Grade, No Diploma
COMPARE
Lumbee
British West Indian
12th Grade, No Diploma
12th Grade, No Diploma Comparison
Lumbee
British West Indians
85.7%
12TH GRADE, NO DIPLOMA
0.0/ 100
METRIC RATING
327th/ 347
METRIC RANK
88.5%
12TH GRADE, NO DIPLOMA
0.0/ 100
METRIC RATING
290th/ 347
METRIC RANK
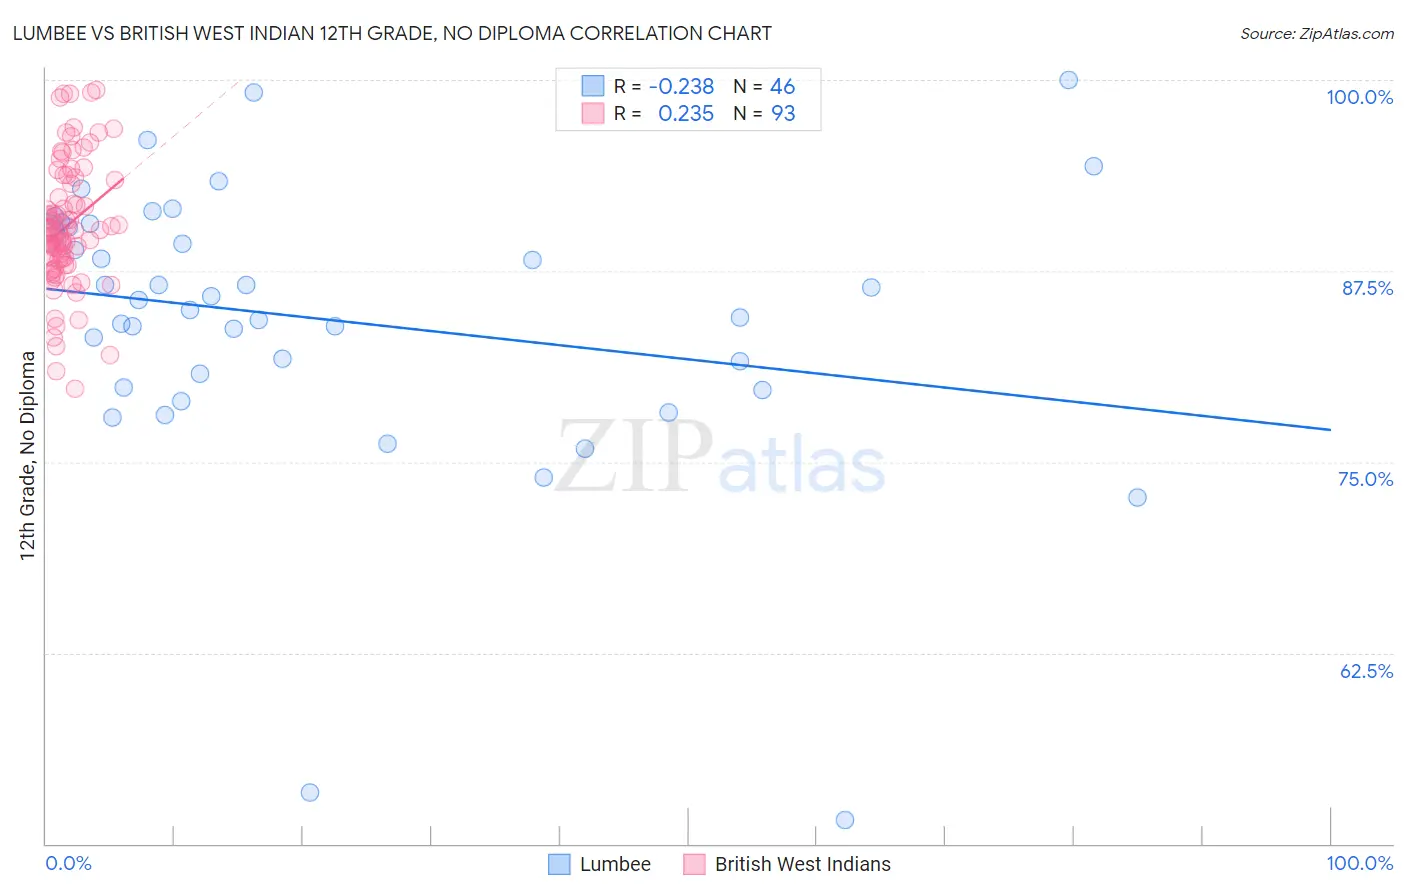
Lumbee vs British West Indian 12th Grade, No Diploma Correlation Chart
The statistical analysis conducted on geographies consisting of 92,299,068 people shows a weak negative correlation between the proportion of Lumbee and percentage of population with at least 12th grade (no diploma) education in the United States with a correlation coefficient (R) of -0.238 and weighted average of 85.7%. Similarly, the statistical analysis conducted on geographies consisting of 152,698,597 people shows a weak positive correlation between the proportion of British West Indians and percentage of population with at least 12th grade (no diploma) education in the United States with a correlation coefficient (R) of 0.235 and weighted average of 88.5%, a difference of 3.3%.
12th Grade, No Diploma Correlation Summary
| Measurement | Lumbee | British West Indian |
| Minimum | 51.6% | 79.8% |
| Maximum | 100.0% | 99.4% |
| Range | 48.4% | 19.6% |
| Mean | 84.3% | 90.5% |
| Median | 85.3% | 90.1% |
| Interquartile 25% (IQ1) | 79.8% | 88.3% |
| Interquartile 75% (IQ3) | 90.3% | 93.3% |
| Interquartile Range (IQR) | 10.5% | 5.0% |
| Standard Deviation (Sample) | 9.3% | 4.1% |
| Standard Deviation (Population) | 9.2% | 4.1% |
Similar Demographics by 12th Grade, No Diploma
Demographics Similar to Lumbee by 12th Grade, No Diploma
In terms of 12th grade, no diploma, the demographic groups most similar to Lumbee are Dominican (85.7%, a difference of 0.010%), Mexican American Indian (85.7%, a difference of 0.030%), Immigrants from Cabo Verde (85.8%, a difference of 0.10%), Honduran (85.5%, a difference of 0.19%), and Hispanic or Latino (85.4%, a difference of 0.28%).
| Demographics | Rating | Rank | 12th Grade, No Diploma |
| Immigrants | Nicaragua | 0.0 /100 | #320 | Tragic 86.6% |
| Puerto Ricans | 0.0 /100 | #321 | Tragic 86.5% |
| Central American Indians | 0.0 /100 | #322 | Tragic 86.5% |
| Yuman | 0.0 /100 | #323 | Tragic 86.5% |
| Immigrants | Cabo Verde | 0.0 /100 | #324 | Tragic 85.8% |
| Mexican American Indians | 0.0 /100 | #325 | Tragic 85.7% |
| Dominicans | 0.0 /100 | #326 | Tragic 85.7% |
| Lumbee | 0.0 /100 | #327 | Tragic 85.7% |
| Hondurans | 0.0 /100 | #328 | Tragic 85.5% |
| Hispanics or Latinos | 0.0 /100 | #329 | Tragic 85.4% |
| Immigrants | Azores | 0.0 /100 | #330 | Tragic 85.3% |
| Central Americans | 0.0 /100 | #331 | Tragic 85.2% |
| Immigrants | Honduras | 0.0 /100 | #332 | Tragic 85.0% |
| Immigrants | Latin America | 0.0 /100 | #333 | Tragic 85.0% |
| Immigrants | Dominican Republic | 0.0 /100 | #334 | Tragic 84.9% |
Demographics Similar to British West Indians by 12th Grade, No Diploma
In terms of 12th grade, no diploma, the demographic groups most similar to British West Indians are Dutch West Indian (88.5%, a difference of 0.0%), Haitian (88.5%, a difference of 0.0%), Immigrants from Fiji (88.6%, a difference of 0.10%), Hopi (88.6%, a difference of 0.11%), and Indonesian (88.6%, a difference of 0.12%).
| Demographics | Rating | Rank | 12th Grade, No Diploma |
| Paiute | 0.0 /100 | #283 | Tragic 88.7% |
| Pennsylvania Germans | 0.0 /100 | #284 | Tragic 88.7% |
| Indonesians | 0.0 /100 | #285 | Tragic 88.6% |
| Immigrants | West Indies | 0.0 /100 | #286 | Tragic 88.6% |
| Hopi | 0.0 /100 | #287 | Tragic 88.6% |
| Immigrants | Fiji | 0.0 /100 | #288 | Tragic 88.6% |
| Dutch West Indians | 0.0 /100 | #289 | Tragic 88.5% |
| British West Indians | 0.0 /100 | #290 | Tragic 88.5% |
| Haitians | 0.0 /100 | #291 | Tragic 88.5% |
| Immigrants | Grenada | 0.0 /100 | #292 | Tragic 88.4% |
| Japanese | 0.0 /100 | #293 | Tragic 88.3% |
| Guyanese | 0.0 /100 | #294 | Tragic 88.3% |
| Immigrants | Immigrants | 0.0 /100 | #295 | Tragic 88.2% |
| Fijians | 0.0 /100 | #296 | Tragic 88.2% |
| Pueblo | 0.0 /100 | #297 | Tragic 88.2% |