Lumbee vs Immigrants from Switzerland Median Household Income
COMPARE
Lumbee
Immigrants from Switzerland
Median Household Income
Median Household Income Comparison
Lumbee
Immigrants from Switzerland
$54,644
MEDIAN HOUSEHOLD INCOME
0.0/ 100
METRIC RATING
347th/ 347
METRIC RANK
$97,979
MEDIAN HOUSEHOLD INCOME
100.0/ 100
METRIC RATING
35th/ 347
METRIC RANK
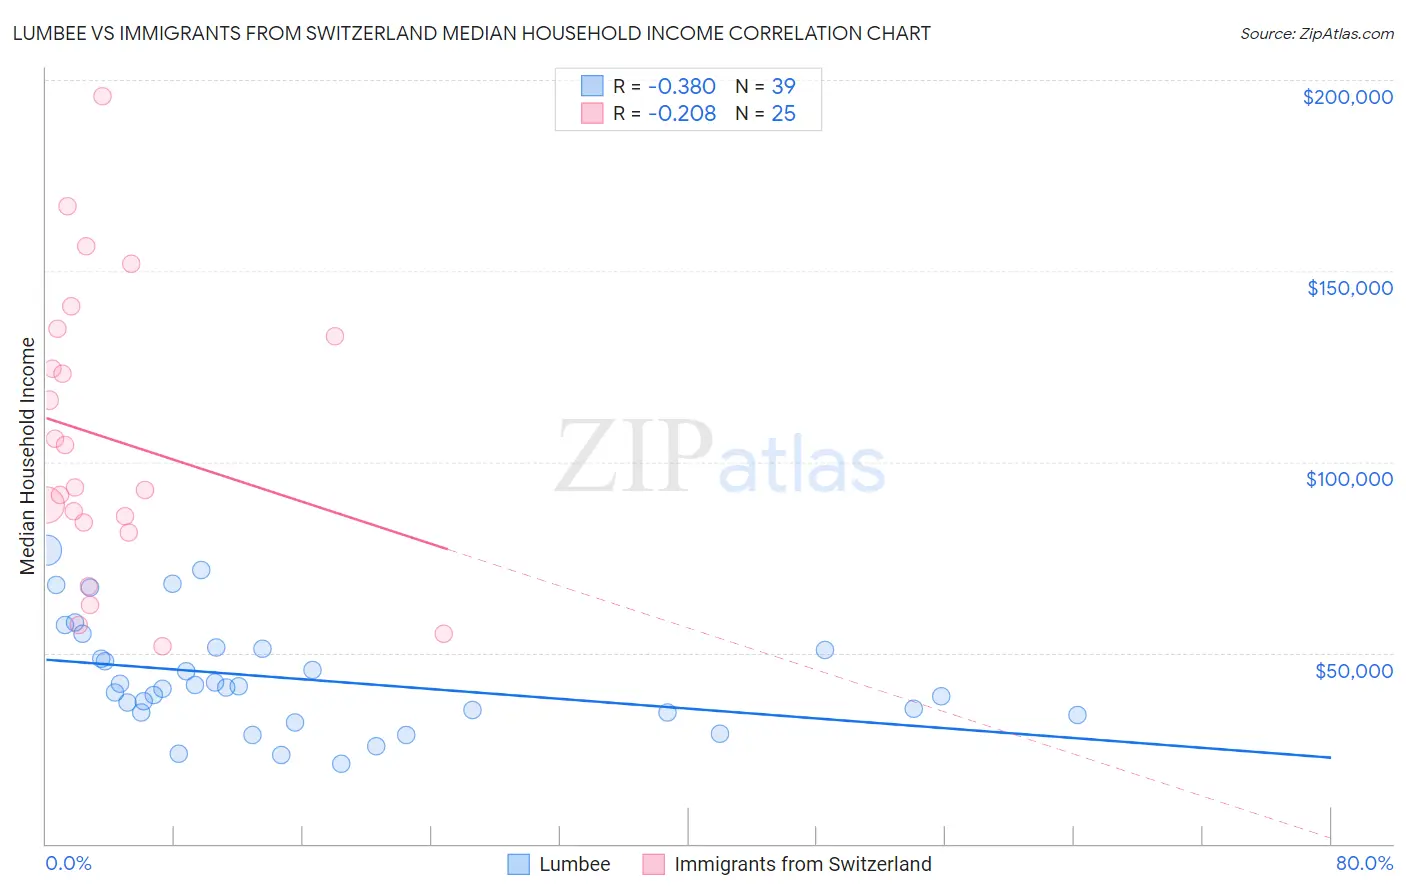
Lumbee vs Immigrants from Switzerland Median Household Income Correlation Chart
The statistical analysis conducted on geographies consisting of 92,249,872 people shows a mild negative correlation between the proportion of Lumbee and median household income in the United States with a correlation coefficient (R) of -0.380 and weighted average of $54,644. Similarly, the statistical analysis conducted on geographies consisting of 148,056,974 people shows a weak negative correlation between the proportion of Immigrants from Switzerland and median household income in the United States with a correlation coefficient (R) of -0.208 and weighted average of $97,979, a difference of 79.3%.
Median Household Income Correlation Summary
| Measurement | Lumbee | Immigrants from Switzerland |
| Minimum | $20,917 | $51,573 |
| Maximum | $76,919 | $195,586 |
| Range | $56,002 | $144,013 |
| Mean | $43,208 | $106,072 |
| Median | $40,857 | $93,190 |
| Interquartile 25% (IQ1) | $34,279 | $82,852 |
| Interquartile 75% (IQ3) | $51,174 | $133,796 |
| Interquartile Range (IQR) | $16,895 | $50,943 |
| Standard Deviation (Sample) | $13,998 | $37,589 |
| Standard Deviation (Population) | $13,817 | $36,829 |
Similar Demographics by Median Household Income
Demographics Similar to Lumbee by Median Household Income
In terms of median household income, the demographic groups most similar to Lumbee are Navajo ($59,159, a difference of 8.3%), Puerto Rican ($59,197, a difference of 8.3%), Tohono O'odham ($61,663, a difference of 12.8%), Houma ($62,575, a difference of 14.5%), and Pima ($63,262, a difference of 15.8%).
| Demographics | Rating | Rank | Median Household Income |
| Creek | 0.0 /100 | #333 | Tragic $67,715 |
| Blacks/African Americans | 0.0 /100 | #334 | Tragic $67,573 |
| Cheyenne | 0.0 /100 | #335 | Tragic $66,974 |
| Immigrants | Congo | 0.0 /100 | #336 | Tragic $66,768 |
| Kiowa | 0.0 /100 | #337 | Tragic $65,914 |
| Immigrants | Yemen | 0.0 /100 | #338 | Tragic $65,194 |
| Hopi | 0.0 /100 | #339 | Tragic $65,043 |
| Pueblo | 0.0 /100 | #340 | Tragic $64,692 |
| Crow | 0.0 /100 | #341 | Tragic $63,681 |
| Pima | 0.0 /100 | #342 | Tragic $63,262 |
| Houma | 0.0 /100 | #343 | Tragic $62,575 |
| Tohono O'odham | 0.0 /100 | #344 | Tragic $61,663 |
| Puerto Ricans | 0.0 /100 | #345 | Tragic $59,197 |
| Navajo | 0.0 /100 | #346 | Tragic $59,159 |
| Lumbee | 0.0 /100 | #347 | Tragic $54,644 |
Demographics Similar to Immigrants from Switzerland by Median Household Income
In terms of median household income, the demographic groups most similar to Immigrants from Switzerland are Russian ($98,008, a difference of 0.030%), Immigrants from Pakistan ($97,528, a difference of 0.46%), Chinese ($98,496, a difference of 0.53%), Immigrants from Denmark ($98,510, a difference of 0.54%), and Latvian ($97,311, a difference of 0.69%).
| Demographics | Rating | Rank | Median Household Income |
| Immigrants | Sri Lanka | 100.0 /100 | #28 | Exceptional $99,943 |
| Immigrants | Asia | 100.0 /100 | #29 | Exceptional $99,933 |
| Immigrants | Northern Europe | 100.0 /100 | #30 | Exceptional $99,813 |
| Turks | 100.0 /100 | #31 | Exceptional $99,389 |
| Immigrants | Denmark | 100.0 /100 | #32 | Exceptional $98,510 |
| Chinese | 100.0 /100 | #33 | Exceptional $98,496 |
| Russians | 100.0 /100 | #34 | Exceptional $98,008 |
| Immigrants | Switzerland | 100.0 /100 | #35 | Exceptional $97,979 |
| Immigrants | Pakistan | 100.0 /100 | #36 | Exceptional $97,528 |
| Latvians | 100.0 /100 | #37 | Exceptional $97,311 |
| Immigrants | Indonesia | 100.0 /100 | #38 | Exceptional $97,297 |
| Afghans | 100.0 /100 | #39 | Exceptional $97,026 |
| Maltese | 100.0 /100 | #40 | Exceptional $97,015 |
| Immigrants | Turkey | 100.0 /100 | #41 | Exceptional $96,964 |
| Immigrants | Lithuania | 99.9 /100 | #42 | Exceptional $96,836 |