Immigrants from Bangladesh vs British West Indian Median Household Income
COMPARE
Immigrants from Bangladesh
British West Indian
Median Household Income
Median Household Income Comparison
Immigrants from Bangladesh
British West Indians
$80,722
MEDIAN HOUSEHOLD INCOME
5.7/ 100
METRIC RATING
228th/ 347
METRIC RANK
$75,647
MEDIAN HOUSEHOLD INCOME
0.2/ 100
METRIC RATING
274th/ 347
METRIC RANK
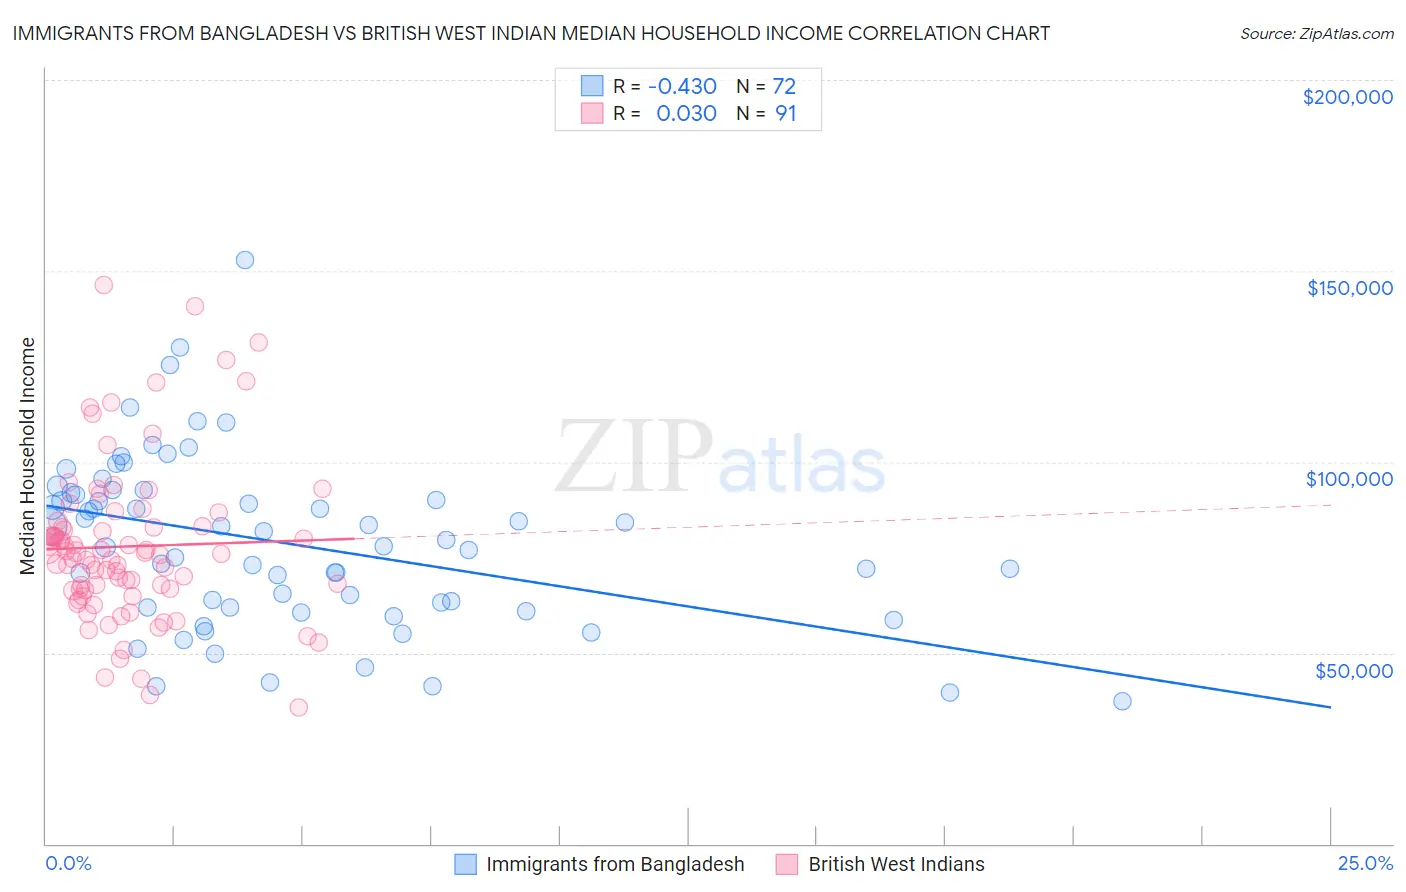
Immigrants from Bangladesh vs British West Indian Median Household Income Correlation Chart
The statistical analysis conducted on geographies consisting of 203,518,199 people shows a moderate negative correlation between the proportion of Immigrants from Bangladesh and median household income in the United States with a correlation coefficient (R) of -0.430 and weighted average of $80,722. Similarly, the statistical analysis conducted on geographies consisting of 152,617,098 people shows no correlation between the proportion of British West Indians and median household income in the United States with a correlation coefficient (R) of 0.030 and weighted average of $75,647, a difference of 6.7%.
Median Household Income Correlation Summary
| Measurement | Immigrants from Bangladesh | British West Indian |
| Minimum | $37,309 | $35,840 |
| Maximum | $152,768 | $146,303 |
| Range | $115,459 | $110,463 |
| Mean | $78,626 | $77,834 |
| Median | $78,708 | $75,947 |
| Interquartile 25% (IQ1) | $61,856 | $66,444 |
| Interquartile 75% (IQ3) | $91,563 | $83,003 |
| Interquartile Range (IQR) | $29,707 | $16,558 |
| Standard Deviation (Sample) | $22,431 | $20,857 |
| Standard Deviation (Population) | $22,274 | $20,742 |
Similar Demographics by Median Household Income
Demographics Similar to Immigrants from Bangladesh by Median Household Income
In terms of median household income, the demographic groups most similar to Immigrants from Bangladesh are Guyanese ($80,734, a difference of 0.010%), Immigrants from Panama ($80,873, a difference of 0.19%), Delaware ($80,527, a difference of 0.24%), Scotch-Irish ($80,972, a difference of 0.31%), and Bermudan ($80,406, a difference of 0.39%).
| Demographics | Rating | Rank | Median Household Income |
| Immigrants | Ghana | 9.0 /100 | #221 | Tragic $81,489 |
| Immigrants | Nigeria | 7.7 /100 | #222 | Tragic $81,236 |
| Immigrants | El Salvador | 7.6 /100 | #223 | Tragic $81,213 |
| Malaysians | 7.0 /100 | #224 | Tragic $81,064 |
| Scotch-Irish | 6.6 /100 | #225 | Tragic $80,972 |
| Immigrants | Panama | 6.2 /100 | #226 | Tragic $80,873 |
| Guyanese | 5.7 /100 | #227 | Tragic $80,734 |
| Immigrants | Bangladesh | 5.7 /100 | #228 | Tragic $80,722 |
| Delaware | 5.0 /100 | #229 | Tragic $80,527 |
| Bermudans | 4.7 /100 | #230 | Tragic $80,406 |
| Trinidadians and Tobagonians | 4.7 /100 | #231 | Tragic $80,402 |
| Immigrants | Trinidad and Tobago | 4.6 /100 | #232 | Tragic $80,373 |
| Immigrants | Azores | 4.5 /100 | #233 | Tragic $80,357 |
| Immigrants | Ecuador | 4.5 /100 | #234 | Tragic $80,341 |
| Immigrants | Guyana | 4.5 /100 | #235 | Tragic $80,324 |
Demographics Similar to British West Indians by Median Household Income
In terms of median household income, the demographic groups most similar to British West Indians are Liberian ($75,667, a difference of 0.030%), Immigrants from Micronesia ($75,574, a difference of 0.10%), Somali ($75,782, a difference of 0.18%), Pennsylvania German ($75,814, a difference of 0.22%), and Hmong ($75,839, a difference of 0.25%).
| Demographics | Rating | Rank | Median Household Income |
| German Russians | 0.3 /100 | #267 | Tragic $75,856 |
| Immigrants | Jamaica | 0.3 /100 | #268 | Tragic $75,851 |
| Cape Verdeans | 0.3 /100 | #269 | Tragic $75,848 |
| Hmong | 0.3 /100 | #270 | Tragic $75,839 |
| Pennsylvania Germans | 0.3 /100 | #271 | Tragic $75,814 |
| Somalis | 0.3 /100 | #272 | Tragic $75,782 |
| Liberians | 0.2 /100 | #273 | Tragic $75,667 |
| British West Indians | 0.2 /100 | #274 | Tragic $75,647 |
| Immigrants | Micronesia | 0.2 /100 | #275 | Tragic $75,574 |
| Immigrants | Latin America | 0.2 /100 | #276 | Tragic $75,420 |
| Spanish Americans | 0.2 /100 | #277 | Tragic $75,386 |
| Osage | 0.2 /100 | #278 | Tragic $75,240 |
| Immigrants | Guatemala | 0.2 /100 | #279 | Tragic $75,123 |
| Senegalese | 0.2 /100 | #280 | Tragic $74,999 |
| Immigrants | Liberia | 0.1 /100 | #281 | Tragic $74,896 |