Lumbee vs Asian Median Household Income
COMPARE
Lumbee
Asian
Median Household Income
Median Household Income Comparison
Lumbee
Asians
$54,644
MEDIAN HOUSEHOLD INCOME
0.0/ 100
METRIC RATING
347th/ 347
METRIC RANK
$101,681
MEDIAN HOUSEHOLD INCOME
100.0/ 100
METRIC RATING
22nd/ 347
METRIC RANK
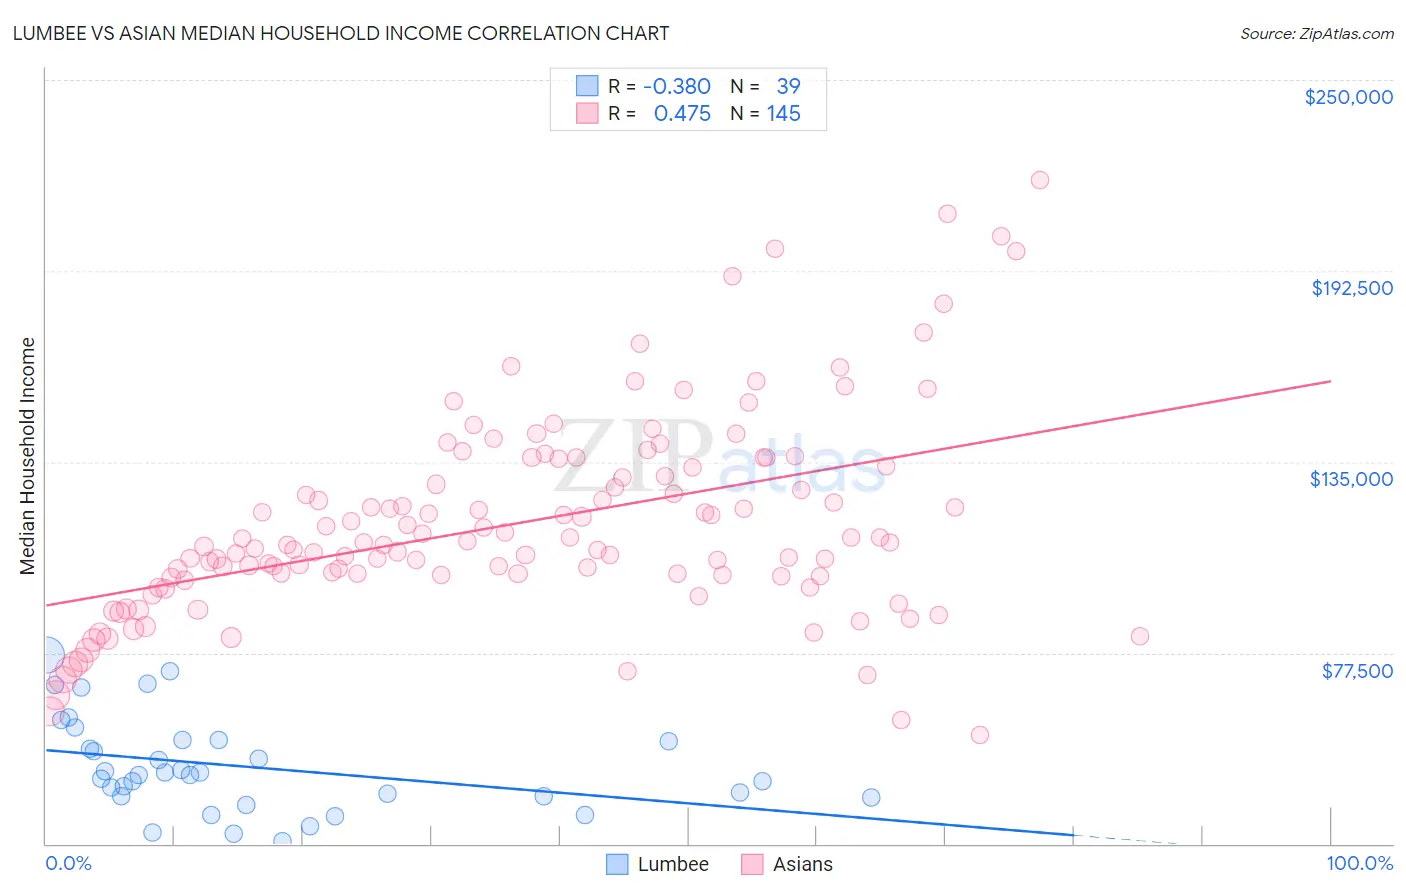
Lumbee vs Asian Median Household Income Correlation Chart
The statistical analysis conducted on geographies consisting of 92,249,872 people shows a mild negative correlation between the proportion of Lumbee and median household income in the United States with a correlation coefficient (R) of -0.380 and weighted average of $54,644. Similarly, the statistical analysis conducted on geographies consisting of 549,980,753 people shows a moderate positive correlation between the proportion of Asians and median household income in the United States with a correlation coefficient (R) of 0.475 and weighted average of $101,681, a difference of 86.1%.
Median Household Income Correlation Summary
| Measurement | Lumbee | Asian |
| Minimum | $20,917 | $52,658 |
| Maximum | $76,919 | $219,913 |
| Range | $56,002 | $167,255 |
| Mean | $43,208 | $116,419 |
| Median | $40,857 | $110,126 |
| Interquartile 25% (IQ1) | $34,279 | $100,433 |
| Interquartile 75% (IQ3) | $51,174 | $133,482 |
| Interquartile Range (IQR) | $16,895 | $33,049 |
| Standard Deviation (Sample) | $13,998 | $30,496 |
| Standard Deviation (Population) | $13,817 | $30,391 |
Similar Demographics by Median Household Income
Demographics Similar to Lumbee by Median Household Income
In terms of median household income, the demographic groups most similar to Lumbee are Navajo ($59,159, a difference of 8.3%), Puerto Rican ($59,197, a difference of 8.3%), Tohono O'odham ($61,663, a difference of 12.8%), Houma ($62,575, a difference of 14.5%), and Pima ($63,262, a difference of 15.8%).
| Demographics | Rating | Rank | Median Household Income |
| Creek | 0.0 /100 | #333 | Tragic $67,715 |
| Blacks/African Americans | 0.0 /100 | #334 | Tragic $67,573 |
| Cheyenne | 0.0 /100 | #335 | Tragic $66,974 |
| Immigrants | Congo | 0.0 /100 | #336 | Tragic $66,768 |
| Kiowa | 0.0 /100 | #337 | Tragic $65,914 |
| Immigrants | Yemen | 0.0 /100 | #338 | Tragic $65,194 |
| Hopi | 0.0 /100 | #339 | Tragic $65,043 |
| Pueblo | 0.0 /100 | #340 | Tragic $64,692 |
| Crow | 0.0 /100 | #341 | Tragic $63,681 |
| Pima | 0.0 /100 | #342 | Tragic $63,262 |
| Houma | 0.0 /100 | #343 | Tragic $62,575 |
| Tohono O'odham | 0.0 /100 | #344 | Tragic $61,663 |
| Puerto Ricans | 0.0 /100 | #345 | Tragic $59,197 |
| Navajo | 0.0 /100 | #346 | Tragic $59,159 |
| Lumbee | 0.0 /100 | #347 | Tragic $54,644 |
Demographics Similar to Asians by Median Household Income
In terms of median household income, the demographic groups most similar to Asians are Eastern European ($101,781, a difference of 0.10%), Immigrants from Bolivia ($101,394, a difference of 0.28%), Bolivian ($102,195, a difference of 0.50%), Immigrants from Australia ($102,562, a difference of 0.87%), and Immigrants from Japan ($100,711, a difference of 0.96%).
| Demographics | Rating | Rank | Median Household Income |
| Immigrants | Israel | 100.0 /100 | #15 | Exceptional $104,090 |
| Burmese | 100.0 /100 | #16 | Exceptional $103,145 |
| Immigrants | Korea | 100.0 /100 | #17 | Exceptional $102,962 |
| Cypriots | 100.0 /100 | #18 | Exceptional $102,843 |
| Immigrants | Australia | 100.0 /100 | #19 | Exceptional $102,562 |
| Bolivians | 100.0 /100 | #20 | Exceptional $102,195 |
| Eastern Europeans | 100.0 /100 | #21 | Exceptional $101,781 |
| Asians | 100.0 /100 | #22 | Exceptional $101,681 |
| Immigrants | Bolivia | 100.0 /100 | #23 | Exceptional $101,394 |
| Immigrants | Japan | 100.0 /100 | #24 | Exceptional $100,711 |
| Immigrants | Sweden | 100.0 /100 | #25 | Exceptional $100,699 |
| Immigrants | Belgium | 100.0 /100 | #26 | Exceptional $100,306 |
| Bhutanese | 100.0 /100 | #27 | Exceptional $100,151 |
| Immigrants | Sri Lanka | 100.0 /100 | #28 | Exceptional $99,943 |
| Immigrants | Asia | 100.0 /100 | #29 | Exceptional $99,933 |