Senegalese vs British West Indian Median Household Income
COMPARE
Senegalese
British West Indian
Median Household Income
Median Household Income Comparison
Senegalese
British West Indians
$74,999
MEDIAN HOUSEHOLD INCOME
0.2/ 100
METRIC RATING
280th/ 347
METRIC RANK
$75,647
MEDIAN HOUSEHOLD INCOME
0.2/ 100
METRIC RATING
274th/ 347
METRIC RANK
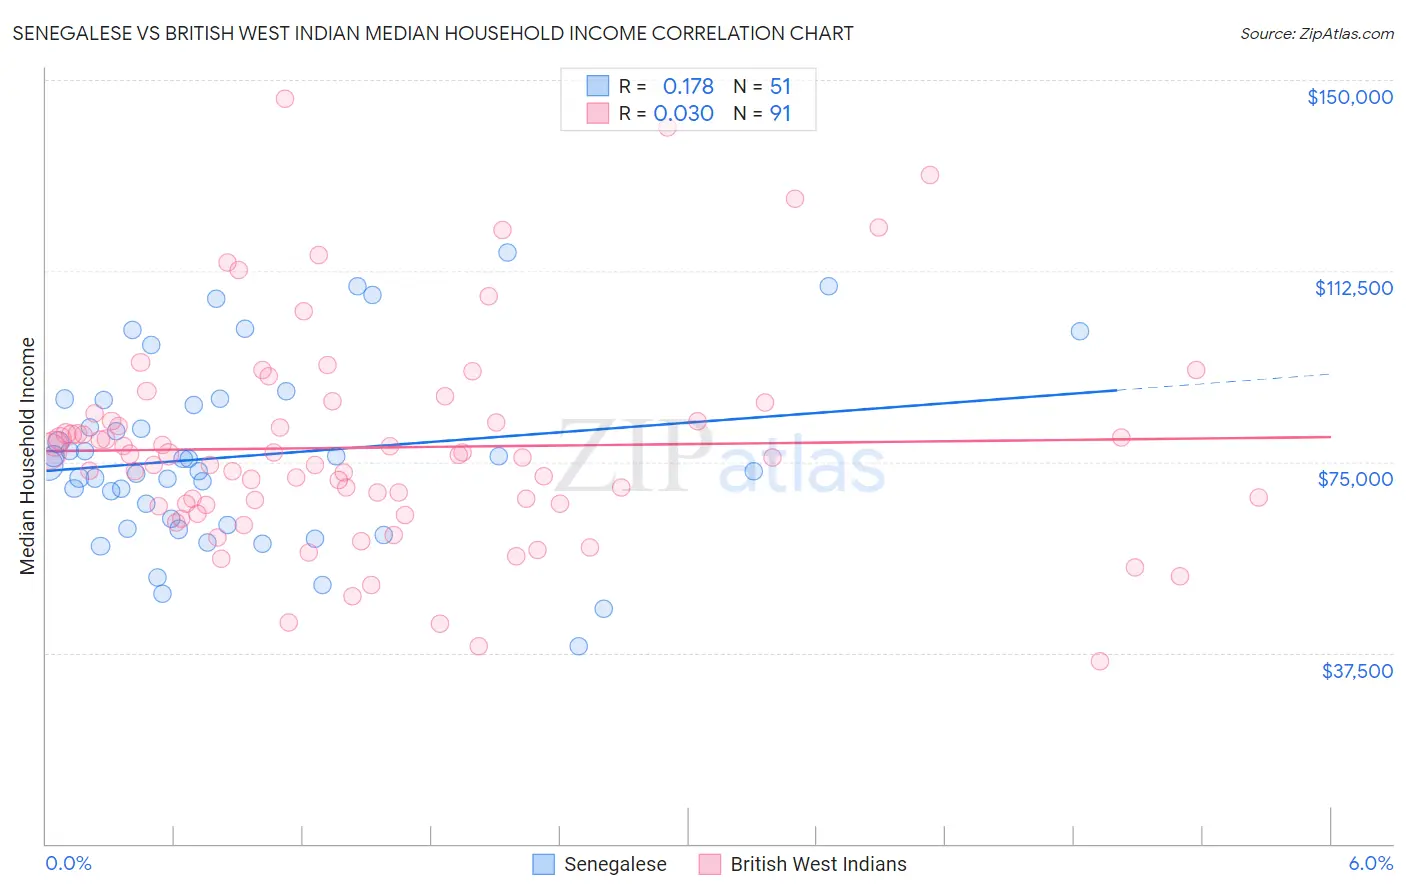
Senegalese vs British West Indian Median Household Income Correlation Chart
The statistical analysis conducted on geographies consisting of 78,073,894 people shows a poor positive correlation between the proportion of Senegalese and median household income in the United States with a correlation coefficient (R) of 0.178 and weighted average of $74,999. Similarly, the statistical analysis conducted on geographies consisting of 152,617,098 people shows no correlation between the proportion of British West Indians and median household income in the United States with a correlation coefficient (R) of 0.030 and weighted average of $75,647, a difference of 0.86%.
Median Household Income Correlation Summary
| Measurement | Senegalese | British West Indian |
| Minimum | $38,686 | $35,840 |
| Maximum | $116,116 | $146,303 |
| Range | $77,430 | $110,463 |
| Mean | $76,167 | $77,834 |
| Median | $74,286 | $75,947 |
| Interquartile 25% (IQ1) | $62,685 | $66,444 |
| Interquartile 75% (IQ3) | $87,125 | $83,003 |
| Interquartile Range (IQR) | $24,440 | $16,558 |
| Standard Deviation (Sample) | $17,624 | $20,857 |
| Standard Deviation (Population) | $17,451 | $20,742 |
Demographics Similar to Senegalese and British West Indians by Median Household Income
In terms of median household income, the demographic groups most similar to Senegalese are Immigrants from Liberia ($74,896, a difference of 0.14%), Immigrants from Guatemala ($75,123, a difference of 0.16%), Central American Indian ($74,847, a difference of 0.20%), Osage ($75,240, a difference of 0.32%), and Cree ($74,685, a difference of 0.42%). Similarly, the demographic groups most similar to British West Indians are Liberian ($75,667, a difference of 0.030%), Immigrants from Micronesia ($75,574, a difference of 0.10%), Somali ($75,782, a difference of 0.18%), Pennsylvania German ($75,814, a difference of 0.22%), and Hmong ($75,839, a difference of 0.25%).
| Demographics | Rating | Rank | Median Household Income |
| German Russians | 0.3 /100 | #267 | Tragic $75,856 |
| Immigrants | Jamaica | 0.3 /100 | #268 | Tragic $75,851 |
| Cape Verdeans | 0.3 /100 | #269 | Tragic $75,848 |
| Hmong | 0.3 /100 | #270 | Tragic $75,839 |
| Pennsylvania Germans | 0.3 /100 | #271 | Tragic $75,814 |
| Somalis | 0.3 /100 | #272 | Tragic $75,782 |
| Liberians | 0.2 /100 | #273 | Tragic $75,667 |
| British West Indians | 0.2 /100 | #274 | Tragic $75,647 |
| Immigrants | Micronesia | 0.2 /100 | #275 | Tragic $75,574 |
| Immigrants | Latin America | 0.2 /100 | #276 | Tragic $75,420 |
| Spanish Americans | 0.2 /100 | #277 | Tragic $75,386 |
| Osage | 0.2 /100 | #278 | Tragic $75,240 |
| Immigrants | Guatemala | 0.2 /100 | #279 | Tragic $75,123 |
| Senegalese | 0.2 /100 | #280 | Tragic $74,999 |
| Immigrants | Liberia | 0.1 /100 | #281 | Tragic $74,896 |
| Central American Indians | 0.1 /100 | #282 | Tragic $74,847 |
| Cree | 0.1 /100 | #283 | Tragic $74,685 |
| Yaqui | 0.1 /100 | #284 | Tragic $74,596 |
| Mexicans | 0.1 /100 | #285 | Tragic $74,399 |
| Immigrants | Somalia | 0.1 /100 | #286 | Tragic $74,300 |
| Iroquois | 0.1 /100 | #287 | Tragic $74,279 |