Blackfeet vs British West Indian Median Household Income
COMPARE
Blackfeet
British West Indian
Median Household Income
Median Household Income Comparison
Blackfeet
British West Indians
$73,509
MEDIAN HOUSEHOLD INCOME
0.1/ 100
METRIC RATING
294th/ 347
METRIC RANK
$75,647
MEDIAN HOUSEHOLD INCOME
0.2/ 100
METRIC RATING
274th/ 347
METRIC RANK
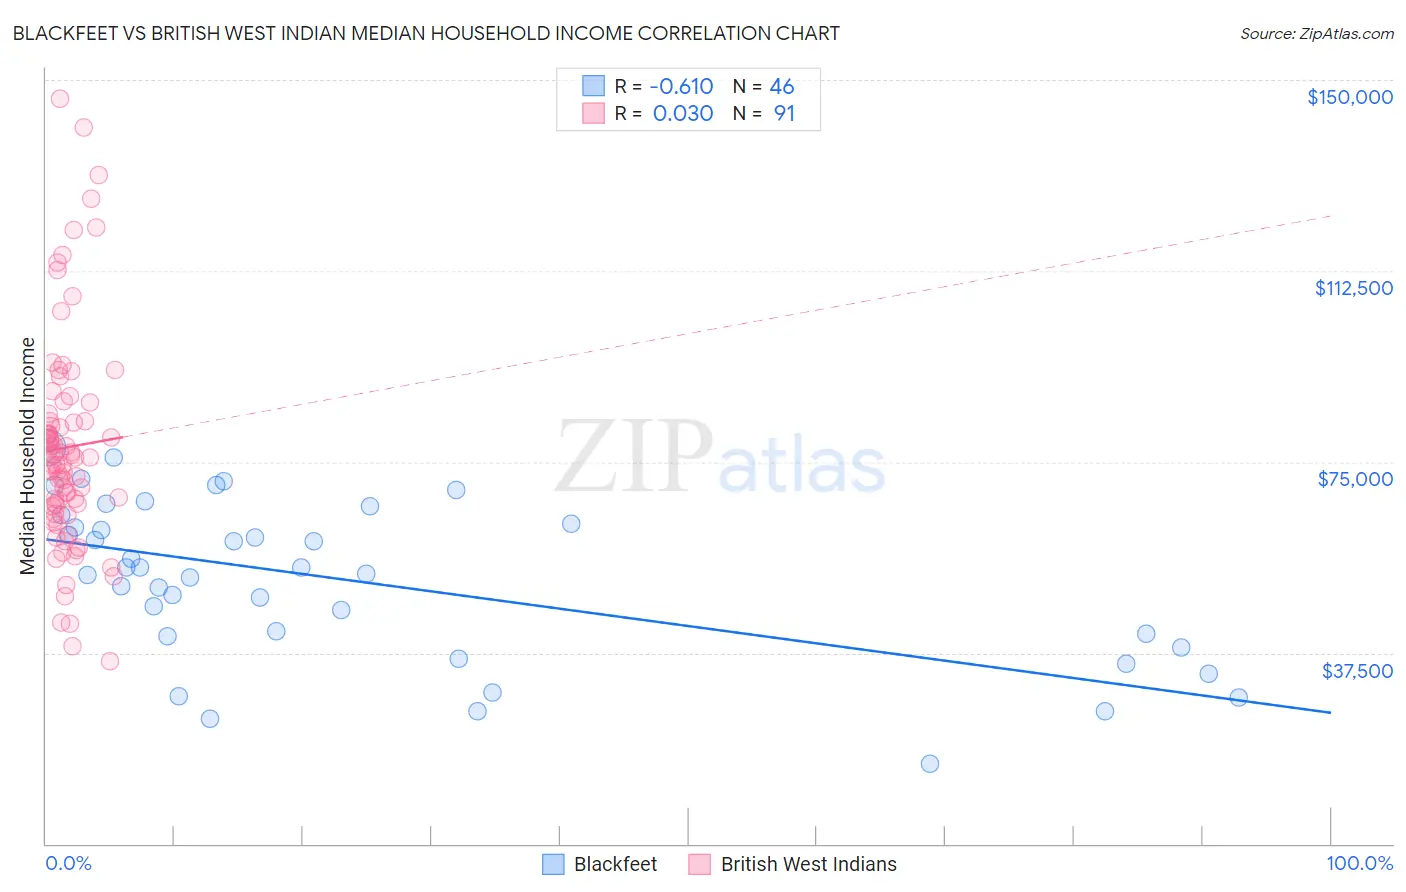
Blackfeet vs British West Indian Median Household Income Correlation Chart
The statistical analysis conducted on geographies consisting of 309,432,508 people shows a significant negative correlation between the proportion of Blackfeet and median household income in the United States with a correlation coefficient (R) of -0.610 and weighted average of $73,509. Similarly, the statistical analysis conducted on geographies consisting of 152,617,098 people shows no correlation between the proportion of British West Indians and median household income in the United States with a correlation coefficient (R) of 0.030 and weighted average of $75,647, a difference of 2.9%.
Median Household Income Correlation Summary
| Measurement | Blackfeet | British West Indian |
| Minimum | $15,625 | $35,840 |
| Maximum | $77,855 | $146,303 |
| Range | $62,230 | $110,463 |
| Mean | $51,582 | $77,834 |
| Median | $53,641 | $75,947 |
| Interquartile 25% (IQ1) | $40,750 | $66,444 |
| Interquartile 75% (IQ3) | $62,870 | $83,003 |
| Interquartile Range (IQR) | $22,120 | $16,558 |
| Standard Deviation (Sample) | $15,583 | $20,857 |
| Standard Deviation (Population) | $15,413 | $20,742 |
Demographics Similar to Blackfeet and British West Indians by Median Household Income
In terms of median household income, the demographic groups most similar to Blackfeet are Immigrants from Cabo Verde ($73,515, a difference of 0.010%), Comanche ($73,747, a difference of 0.32%), Hispanic or Latino ($73,823, a difference of 0.43%), Bangladeshi ($74,112, a difference of 0.82%), and Fijian ($74,205, a difference of 0.95%). Similarly, the demographic groups most similar to British West Indians are Immigrants from Micronesia ($75,574, a difference of 0.10%), Immigrants from Latin America ($75,420, a difference of 0.30%), Spanish American ($75,386, a difference of 0.35%), Osage ($75,240, a difference of 0.54%), and Immigrants from Guatemala ($75,123, a difference of 0.70%).
| Demographics | Rating | Rank | Median Household Income |
| British West Indians | 0.2 /100 | #274 | Tragic $75,647 |
| Immigrants | Micronesia | 0.2 /100 | #275 | Tragic $75,574 |
| Immigrants | Latin America | 0.2 /100 | #276 | Tragic $75,420 |
| Spanish Americans | 0.2 /100 | #277 | Tragic $75,386 |
| Osage | 0.2 /100 | #278 | Tragic $75,240 |
| Immigrants | Guatemala | 0.2 /100 | #279 | Tragic $75,123 |
| Senegalese | 0.2 /100 | #280 | Tragic $74,999 |
| Immigrants | Liberia | 0.1 /100 | #281 | Tragic $74,896 |
| Central American Indians | 0.1 /100 | #282 | Tragic $74,847 |
| Cree | 0.1 /100 | #283 | Tragic $74,685 |
| Yaqui | 0.1 /100 | #284 | Tragic $74,596 |
| Mexicans | 0.1 /100 | #285 | Tragic $74,399 |
| Immigrants | Somalia | 0.1 /100 | #286 | Tragic $74,300 |
| Iroquois | 0.1 /100 | #287 | Tragic $74,279 |
| Immigrants | Central America | 0.1 /100 | #288 | Tragic $74,217 |
| Fijians | 0.1 /100 | #289 | Tragic $74,205 |
| Bangladeshis | 0.1 /100 | #290 | Tragic $74,112 |
| Hispanics or Latinos | 0.1 /100 | #291 | Tragic $73,823 |
| Comanche | 0.1 /100 | #292 | Tragic $73,747 |
| Immigrants | Cabo Verde | 0.1 /100 | #293 | Tragic $73,515 |
| Blackfeet | 0.1 /100 | #294 | Tragic $73,509 |