Yakama vs British West Indian Median Household Income
COMPARE
Yakama
British West Indian
Median Household Income
Median Household Income Comparison
Yakama
British West Indians
$72,225
MEDIAN HOUSEHOLD INCOME
0.0/ 100
METRIC RATING
308th/ 347
METRIC RANK
$75,647
MEDIAN HOUSEHOLD INCOME
0.2/ 100
METRIC RATING
274th/ 347
METRIC RANK
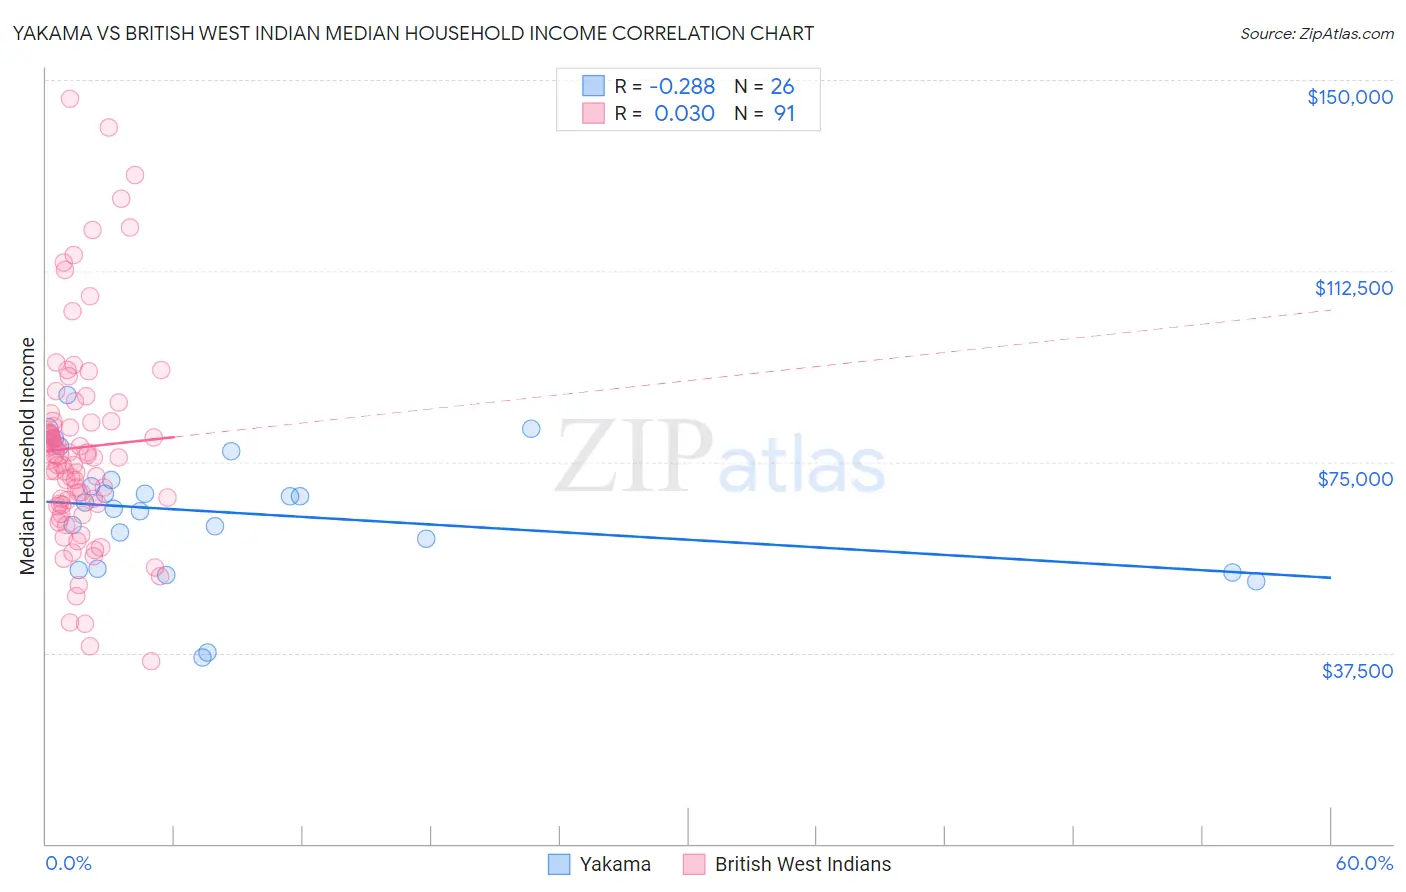
Yakama vs British West Indian Median Household Income Correlation Chart
The statistical analysis conducted on geographies consisting of 19,909,650 people shows a weak negative correlation between the proportion of Yakama and median household income in the United States with a correlation coefficient (R) of -0.288 and weighted average of $72,225. Similarly, the statistical analysis conducted on geographies consisting of 152,617,098 people shows no correlation between the proportion of British West Indians and median household income in the United States with a correlation coefficient (R) of 0.030 and weighted average of $75,647, a difference of 4.7%.
Median Household Income Correlation Summary
| Measurement | Yakama | British West Indian |
| Minimum | $36,563 | $35,840 |
| Maximum | $88,202 | $146,303 |
| Range | $51,639 | $110,463 |
| Mean | $64,818 | $77,834 |
| Median | $66,477 | $75,947 |
| Interquartile 25% (IQ1) | $54,107 | $66,444 |
| Interquartile 75% (IQ3) | $71,429 | $83,003 |
| Interquartile Range (IQR) | $17,322 | $16,558 |
| Standard Deviation (Sample) | $12,734 | $20,857 |
| Standard Deviation (Population) | $12,487 | $20,742 |
Similar Demographics by Median Household Income
Demographics Similar to Yakama by Median Household Income
In terms of median household income, the demographic groups most similar to Yakama are Ute ($72,402, a difference of 0.25%), Potawatomi ($72,576, a difference of 0.49%), Honduran ($72,588, a difference of 0.50%), Immigrants from Caribbean ($71,860, a difference of 0.51%), and Immigrants from Haiti ($72,599, a difference of 0.52%).
| Demographics | Rating | Rank | Median Household Income |
| Cherokee | 0.0 /100 | #301 | Tragic $72,682 |
| Shoshone | 0.0 /100 | #302 | Tragic $72,660 |
| Africans | 0.0 /100 | #303 | Tragic $72,650 |
| Immigrants | Haiti | 0.0 /100 | #304 | Tragic $72,599 |
| Hondurans | 0.0 /100 | #305 | Tragic $72,588 |
| Potawatomi | 0.0 /100 | #306 | Tragic $72,576 |
| Ute | 0.0 /100 | #307 | Tragic $72,402 |
| Yakama | 0.0 /100 | #308 | Tragic $72,225 |
| Immigrants | Caribbean | 0.0 /100 | #309 | Tragic $71,860 |
| U.S. Virgin Islanders | 0.0 /100 | #310 | Tragic $71,853 |
| Immigrants | Zaire | 0.0 /100 | #311 | Tragic $71,801 |
| Immigrants | Honduras | 0.0 /100 | #312 | Tragic $71,452 |
| Immigrants | Bahamas | 0.0 /100 | #313 | Tragic $71,349 |
| Dominicans | 0.0 /100 | #314 | Tragic $71,302 |
| Ottawa | 0.0 /100 | #315 | Tragic $70,984 |
Demographics Similar to British West Indians by Median Household Income
In terms of median household income, the demographic groups most similar to British West Indians are Liberian ($75,667, a difference of 0.030%), Immigrants from Micronesia ($75,574, a difference of 0.10%), Somali ($75,782, a difference of 0.18%), Pennsylvania German ($75,814, a difference of 0.22%), and Hmong ($75,839, a difference of 0.25%).
| Demographics | Rating | Rank | Median Household Income |
| German Russians | 0.3 /100 | #267 | Tragic $75,856 |
| Immigrants | Jamaica | 0.3 /100 | #268 | Tragic $75,851 |
| Cape Verdeans | 0.3 /100 | #269 | Tragic $75,848 |
| Hmong | 0.3 /100 | #270 | Tragic $75,839 |
| Pennsylvania Germans | 0.3 /100 | #271 | Tragic $75,814 |
| Somalis | 0.3 /100 | #272 | Tragic $75,782 |
| Liberians | 0.2 /100 | #273 | Tragic $75,667 |
| British West Indians | 0.2 /100 | #274 | Tragic $75,647 |
| Immigrants | Micronesia | 0.2 /100 | #275 | Tragic $75,574 |
| Immigrants | Latin America | 0.2 /100 | #276 | Tragic $75,420 |
| Spanish Americans | 0.2 /100 | #277 | Tragic $75,386 |
| Osage | 0.2 /100 | #278 | Tragic $75,240 |
| Immigrants | Guatemala | 0.2 /100 | #279 | Tragic $75,123 |
| Senegalese | 0.2 /100 | #280 | Tragic $74,999 |
| Immigrants | Liberia | 0.1 /100 | #281 | Tragic $74,896 |