Thai vs Immigrants from Denmark Median Male Earnings
COMPARE
Thai
Immigrants from Denmark
Median Male Earnings
Median Male Earnings Comparison
Thais
Immigrants from Denmark
$72,135
MEDIAN MALE EARNINGS
100.0/ 100
METRIC RATING
4th/ 347
METRIC RANK
$64,625
MEDIAN MALE EARNINGS
100.0/ 100
METRIC RATING
25th/ 347
METRIC RANK
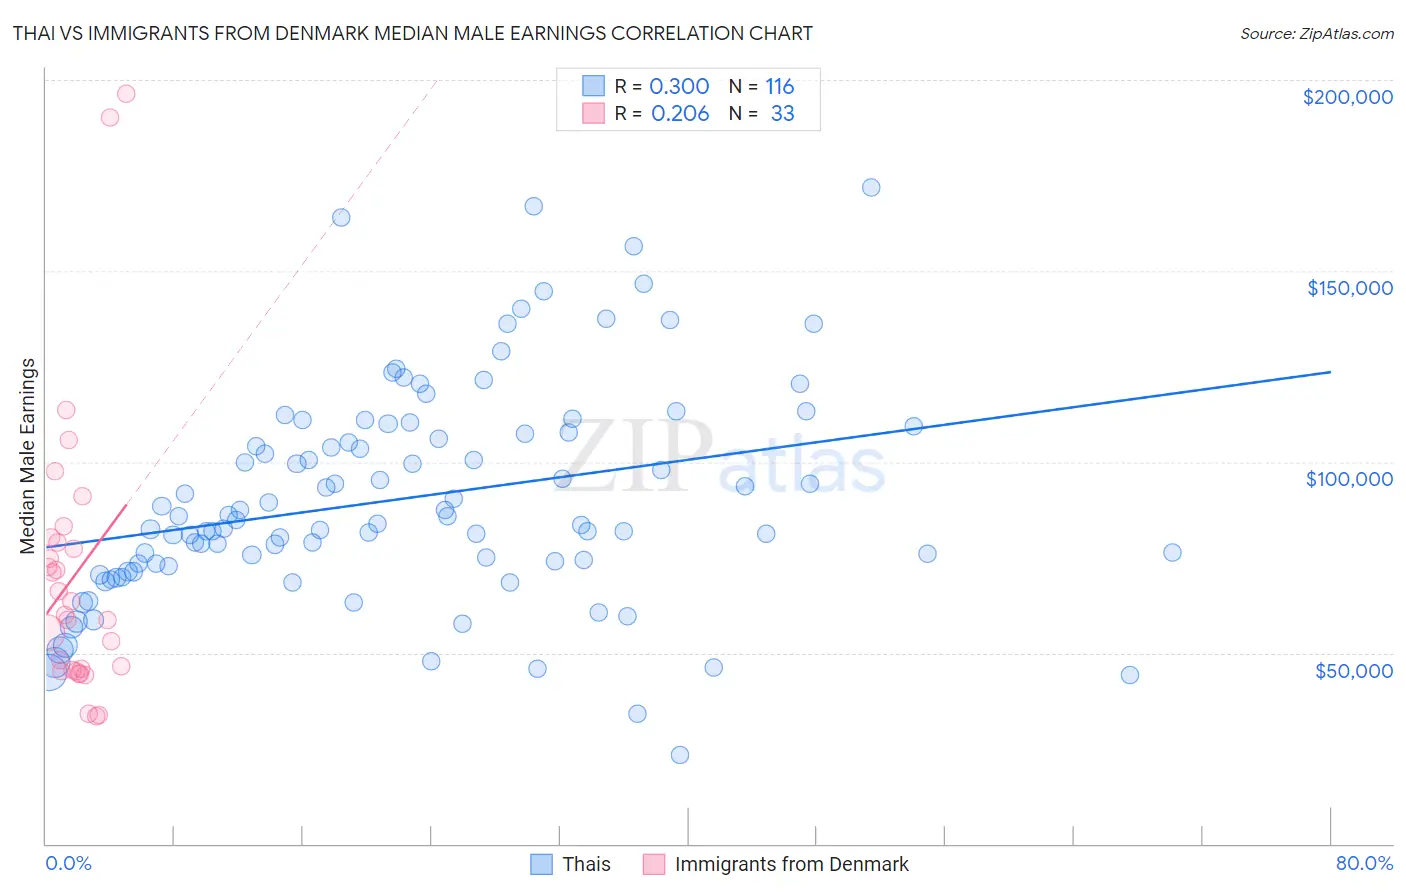
Thai vs Immigrants from Denmark Median Male Earnings Correlation Chart
The statistical analysis conducted on geographies consisting of 475,691,954 people shows a weak positive correlation between the proportion of Thais and median male earnings in the United States with a correlation coefficient (R) of 0.300 and weighted average of $72,135. Similarly, the statistical analysis conducted on geographies consisting of 136,409,110 people shows a weak positive correlation between the proportion of Immigrants from Denmark and median male earnings in the United States with a correlation coefficient (R) of 0.206 and weighted average of $64,625, a difference of 11.6%.
Median Male Earnings Correlation Summary
| Measurement | Thai | Immigrants from Denmark |
| Minimum | $23,362 | $33,446 |
| Maximum | $171,875 | $196,250 |
| Range | $148,513 | $162,804 |
| Mean | $90,264 | $70,566 |
| Median | $84,301 | $59,978 |
| Interquartile 25% (IQ1) | $73,018 | $45,341 |
| Interquartile 75% (IQ3) | $107,587 | $79,588 |
| Interquartile Range (IQR) | $34,569 | $34,248 |
| Standard Deviation (Sample) | $28,453 | $37,718 |
| Standard Deviation (Population) | $28,330 | $37,142 |
Similar Demographics by Median Male Earnings
Demographics Similar to Thais by Median Male Earnings
In terms of median male earnings, the demographic groups most similar to Thais are Immigrants from Singapore ($71,348, a difference of 1.1%), Iranian ($70,648, a difference of 2.1%), Immigrants from Taiwan ($74,031, a difference of 2.6%), Immigrants from Hong Kong ($70,146, a difference of 2.8%), and Immigrants from India ($74,207, a difference of 2.9%).
| Demographics | Rating | Rank | Median Male Earnings |
| Filipinos | 100.0 /100 | #1 | Exceptional $74,224 |
| Immigrants | India | 100.0 /100 | #2 | Exceptional $74,207 |
| Immigrants | Taiwan | 100.0 /100 | #3 | Exceptional $74,031 |
| Thais | 100.0 /100 | #4 | Exceptional $72,135 |
| Immigrants | Singapore | 100.0 /100 | #5 | Exceptional $71,348 |
| Iranians | 100.0 /100 | #6 | Exceptional $70,648 |
| Immigrants | Hong Kong | 100.0 /100 | #7 | Exceptional $70,146 |
| Immigrants | Iran | 100.0 /100 | #8 | Exceptional $69,284 |
| Immigrants | South Central Asia | 100.0 /100 | #9 | Exceptional $68,960 |
| Immigrants | Israel | 100.0 /100 | #10 | Exceptional $68,716 |
| Immigrants | Ireland | 100.0 /100 | #11 | Exceptional $67,698 |
| Immigrants | Australia | 100.0 /100 | #12 | Exceptional $67,634 |
| Immigrants | China | 100.0 /100 | #13 | Exceptional $67,353 |
| Okinawans | 100.0 /100 | #14 | Exceptional $67,232 |
| Immigrants | Eastern Asia | 100.0 /100 | #15 | Exceptional $66,903 |
Demographics Similar to Immigrants from Denmark by Median Male Earnings
In terms of median male earnings, the demographic groups most similar to Immigrants from Denmark are Immigrants from Northern Europe ($64,987, a difference of 0.56%), Turkish ($64,253, a difference of 0.58%), Immigrants from Korea ($65,079, a difference of 0.70%), Burmese ($65,236, a difference of 0.95%), and Immigrants from Switzerland ($63,944, a difference of 1.1%).
| Demographics | Rating | Rank | Median Male Earnings |
| Indians (Asian) | 100.0 /100 | #18 | Exceptional $66,078 |
| Cypriots | 100.0 /100 | #19 | Exceptional $65,549 |
| Immigrants | Japan | 100.0 /100 | #20 | Exceptional $65,518 |
| Immigrants | Sweden | 100.0 /100 | #21 | Exceptional $65,406 |
| Burmese | 100.0 /100 | #22 | Exceptional $65,236 |
| Immigrants | Korea | 100.0 /100 | #23 | Exceptional $65,079 |
| Immigrants | Northern Europe | 100.0 /100 | #24 | Exceptional $64,987 |
| Immigrants | Denmark | 100.0 /100 | #25 | Exceptional $64,625 |
| Turks | 100.0 /100 | #26 | Exceptional $64,253 |
| Immigrants | Switzerland | 100.0 /100 | #27 | Exceptional $63,944 |
| Russians | 100.0 /100 | #28 | Exceptional $63,939 |
| Asians | 100.0 /100 | #29 | Exceptional $63,827 |
| Immigrants | France | 100.0 /100 | #30 | Exceptional $63,715 |
| Latvians | 100.0 /100 | #31 | Exceptional $63,498 |
| Soviet Union | 100.0 /100 | #32 | Exceptional $63,382 |