Lebanese vs Immigrants from Denmark Unemployment Among Women with Children Under 6 years
COMPARE
Lebanese
Immigrants from Denmark
Unemployment Among Women with Children Under 6 years
Unemployment Among Women with Children Under 6 years Comparison
Lebanese
Immigrants from Denmark
7.8%
UNEMPLOYMENT AMONG WOMEN WITH CHILDREN UNDER 6 YEARS
22.2/ 100
METRIC RATING
204th/ 347
METRIC RANK
7.1%
UNEMPLOYMENT AMONG WOMEN WITH CHILDREN UNDER 6 YEARS
98.3/ 100
METRIC RATING
89th/ 347
METRIC RANK
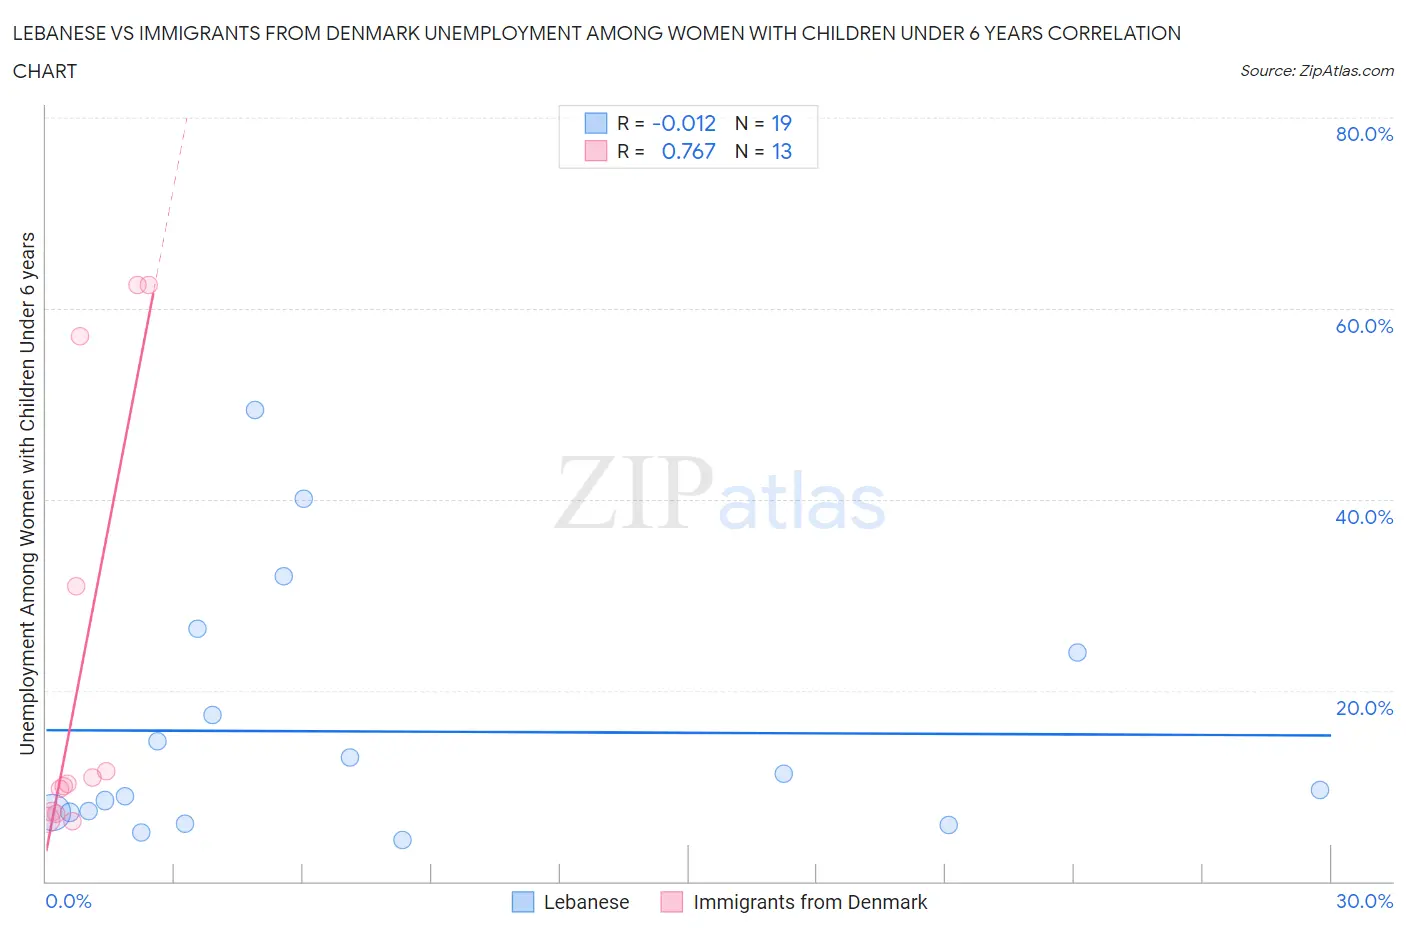
Lebanese vs Immigrants from Denmark Unemployment Among Women with Children Under 6 years Correlation Chart
The statistical analysis conducted on geographies consisting of 301,337,117 people shows no correlation between the proportion of Lebanese and unemployment rate among women with children under the age of 6 in the United States with a correlation coefficient (R) of -0.012 and weighted average of 7.8%. Similarly, the statistical analysis conducted on geographies consisting of 117,608,008 people shows a strong positive correlation between the proportion of Immigrants from Denmark and unemployment rate among women with children under the age of 6 in the United States with a correlation coefficient (R) of 0.767 and weighted average of 7.1%, a difference of 9.4%.
Unemployment Among Women with Children Under 6 years Correlation Summary
| Measurement | Lebanese | Immigrants from Denmark |
| Minimum | 4.3% | 6.3% |
| Maximum | 49.3% | 62.5% |
| Range | 45.0% | 56.2% |
| Mean | 15.7% | 22.5% |
| Median | 9.6% | 10.3% |
| Interquartile 25% (IQ1) | 7.2% | 7.2% |
| Interquartile 75% (IQ3) | 24.0% | 44.0% |
| Interquartile Range (IQR) | 16.8% | 36.8% |
| Standard Deviation (Sample) | 12.9% | 22.7% |
| Standard Deviation (Population) | 12.5% | 21.8% |
Similar Demographics by Unemployment Among Women with Children Under 6 years
Demographics Similar to Lebanese by Unemployment Among Women with Children Under 6 years
In terms of unemployment among women with children under 6 years, the demographic groups most similar to Lebanese are Immigrants (7.8%, a difference of 0.080%), Hungarian (7.8%, a difference of 0.10%), Spaniard (7.8%, a difference of 0.11%), Sudanese (7.8%, a difference of 0.12%), and Canadian (7.8%, a difference of 0.15%).
| Demographics | Rating | Rank | Unemployment Among Women with Children Under 6 years |
| Italians | 30.4 /100 | #197 | Fair 7.7% |
| Lithuanians | 30.0 /100 | #198 | Fair 7.8% |
| Immigrants | Poland | 27.3 /100 | #199 | Fair 7.8% |
| Guamanians/Chamorros | 25.5 /100 | #200 | Fair 7.8% |
| Basques | 24.7 /100 | #201 | Fair 7.8% |
| Sudanese | 23.5 /100 | #202 | Fair 7.8% |
| Spaniards | 23.3 /100 | #203 | Fair 7.8% |
| Lebanese | 22.2 /100 | #204 | Fair 7.8% |
| Immigrants | Immigrants | 21.4 /100 | #205 | Fair 7.8% |
| Hungarians | 21.2 /100 | #206 | Fair 7.8% |
| Canadians | 20.6 /100 | #207 | Fair 7.8% |
| Immigrants | Syria | 18.9 /100 | #208 | Poor 7.8% |
| Costa Ricans | 17.6 /100 | #209 | Poor 7.8% |
| Poles | 16.0 /100 | #210 | Poor 7.9% |
| Immigrants | Ecuador | 14.9 /100 | #211 | Poor 7.9% |
Demographics Similar to Immigrants from Denmark by Unemployment Among Women with Children Under 6 years
In terms of unemployment among women with children under 6 years, the demographic groups most similar to Immigrants from Denmark are Immigrants from Hungary (7.1%, a difference of 0.040%), Immigrants from Spain (7.1%, a difference of 0.050%), Danish (7.1%, a difference of 0.12%), Alsatian (7.1%, a difference of 0.16%), and Albanian (7.2%, a difference of 0.25%).
| Demographics | Rating | Rank | Unemployment Among Women with Children Under 6 years |
| Immigrants | Afghanistan | 98.7 /100 | #82 | Exceptional 7.1% |
| Egyptians | 98.7 /100 | #83 | Exceptional 7.1% |
| Immigrants | Albania | 98.7 /100 | #84 | Exceptional 7.1% |
| Immigrants | Romania | 98.7 /100 | #85 | Exceptional 7.1% |
| Immigrants | Zimbabwe | 98.6 /100 | #86 | Exceptional 7.1% |
| Alsatians | 98.4 /100 | #87 | Exceptional 7.1% |
| Immigrants | Hungary | 98.3 /100 | #88 | Exceptional 7.1% |
| Immigrants | Denmark | 98.3 /100 | #89 | Exceptional 7.1% |
| Immigrants | Spain | 98.2 /100 | #90 | Exceptional 7.1% |
| Danes | 98.2 /100 | #91 | Exceptional 7.1% |
| Albanians | 98.0 /100 | #92 | Exceptional 7.2% |
| New Zealanders | 97.8 /100 | #93 | Exceptional 7.2% |
| Macedonians | 97.7 /100 | #94 | Exceptional 7.2% |
| Romanians | 97.7 /100 | #95 | Exceptional 7.2% |
| Immigrants | Eastern Africa | 97.7 /100 | #96 | Exceptional 7.2% |