Russian vs Immigrants from Denmark Median Male Earnings
COMPARE
Russian
Immigrants from Denmark
Median Male Earnings
Median Male Earnings Comparison
Russians
Immigrants from Denmark
$63,939
MEDIAN MALE EARNINGS
100.0/ 100
METRIC RATING
28th/ 347
METRIC RANK
$64,625
MEDIAN MALE EARNINGS
100.0/ 100
METRIC RATING
25th/ 347
METRIC RANK
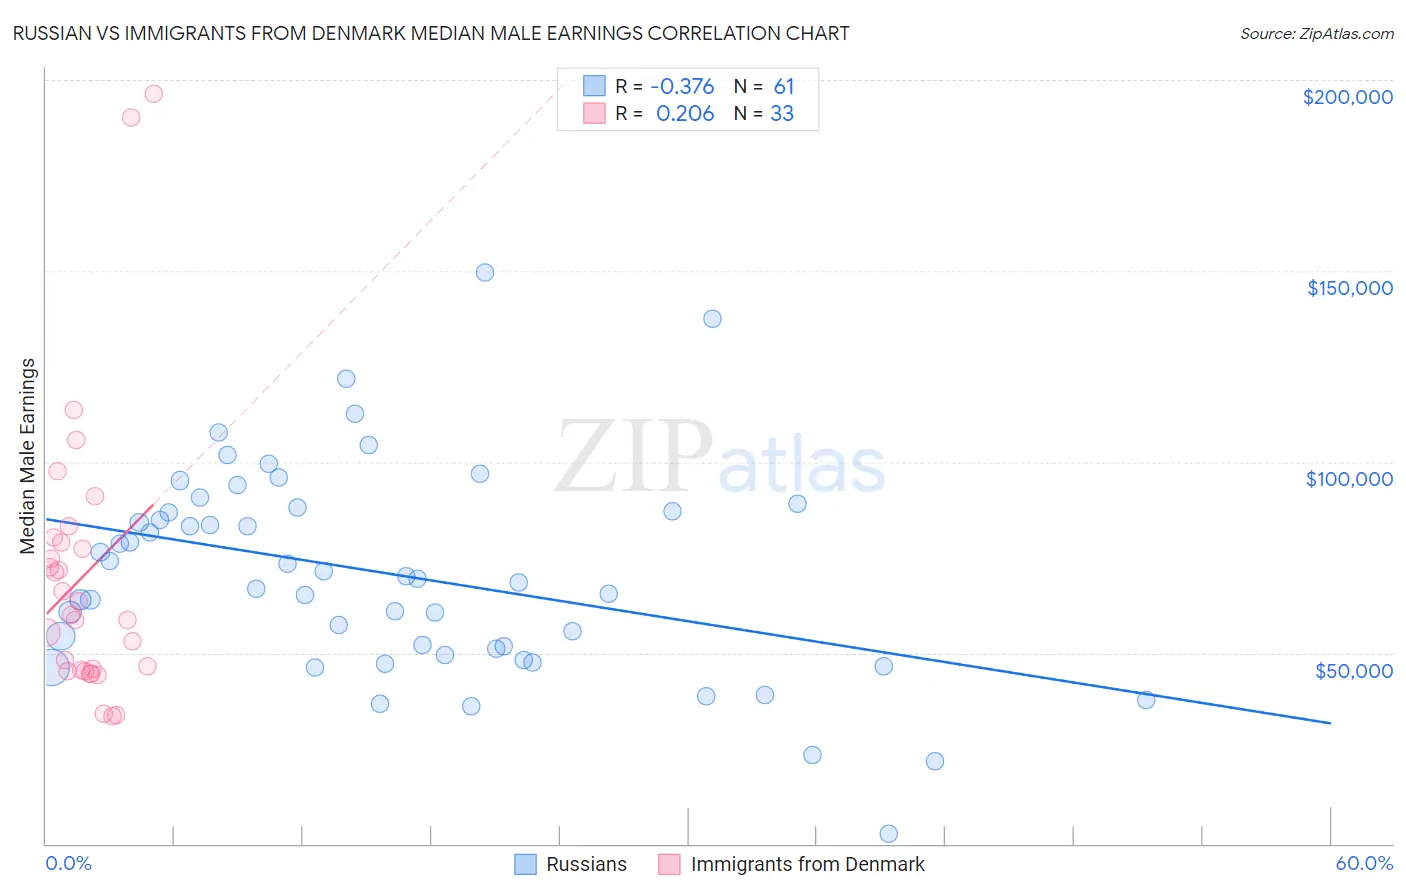
Russian vs Immigrants from Denmark Median Male Earnings Correlation Chart
The statistical analysis conducted on geographies consisting of 511,765,575 people shows a mild negative correlation between the proportion of Russians and median male earnings in the United States with a correlation coefficient (R) of -0.376 and weighted average of $63,939. Similarly, the statistical analysis conducted on geographies consisting of 136,409,110 people shows a weak positive correlation between the proportion of Immigrants from Denmark and median male earnings in the United States with a correlation coefficient (R) of 0.206 and weighted average of $64,625, a difference of 1.1%.
Median Male Earnings Correlation Summary
| Measurement | Russian | Immigrants from Denmark |
| Minimum | $2,499 | $33,446 |
| Maximum | $149,573 | $196,250 |
| Range | $147,074 | $162,804 |
| Mean | $70,744 | $70,566 |
| Median | $69,557 | $59,978 |
| Interquartile 25% (IQ1) | $50,291 | $45,341 |
| Interquartile 75% (IQ3) | $87,600 | $79,588 |
| Interquartile Range (IQR) | $37,309 | $34,248 |
| Standard Deviation (Sample) | $27,498 | $37,718 |
| Standard Deviation (Population) | $27,272 | $37,142 |
Demographics Similar to Russians and Immigrants from Denmark by Median Male Earnings
In terms of median male earnings, the demographic groups most similar to Russians are Immigrants from Switzerland ($63,944, a difference of 0.010%), Asian ($63,827, a difference of 0.17%), Immigrants from France ($63,715, a difference of 0.35%), Turkish ($64,253, a difference of 0.49%), and Latvian ($63,498, a difference of 0.69%). Similarly, the demographic groups most similar to Immigrants from Denmark are Immigrants from Northern Europe ($64,987, a difference of 0.56%), Turkish ($64,253, a difference of 0.58%), Immigrants from Korea ($65,079, a difference of 0.70%), Burmese ($65,236, a difference of 0.95%), and Immigrants from Switzerland ($63,944, a difference of 1.1%).
| Demographics | Rating | Rank | Median Male Earnings |
| Eastern Europeans | 100.0 /100 | #16 | Exceptional $66,472 |
| Immigrants | Belgium | 100.0 /100 | #17 | Exceptional $66,125 |
| Indians (Asian) | 100.0 /100 | #18 | Exceptional $66,078 |
| Cypriots | 100.0 /100 | #19 | Exceptional $65,549 |
| Immigrants | Japan | 100.0 /100 | #20 | Exceptional $65,518 |
| Immigrants | Sweden | 100.0 /100 | #21 | Exceptional $65,406 |
| Burmese | 100.0 /100 | #22 | Exceptional $65,236 |
| Immigrants | Korea | 100.0 /100 | #23 | Exceptional $65,079 |
| Immigrants | Northern Europe | 100.0 /100 | #24 | Exceptional $64,987 |
| Immigrants | Denmark | 100.0 /100 | #25 | Exceptional $64,625 |
| Turks | 100.0 /100 | #26 | Exceptional $64,253 |
| Immigrants | Switzerland | 100.0 /100 | #27 | Exceptional $63,944 |
| Russians | 100.0 /100 | #28 | Exceptional $63,939 |
| Asians | 100.0 /100 | #29 | Exceptional $63,827 |
| Immigrants | France | 100.0 /100 | #30 | Exceptional $63,715 |
| Latvians | 100.0 /100 | #31 | Exceptional $63,498 |
| Soviet Union | 100.0 /100 | #32 | Exceptional $63,382 |
| Immigrants | Lithuania | 100.0 /100 | #33 | Exceptional $63,346 |
| Immigrants | Russia | 100.0 /100 | #34 | Exceptional $63,326 |
| Immigrants | Asia | 100.0 /100 | #35 | Exceptional $63,240 |
| Israelis | 100.0 /100 | #36 | Exceptional $63,228 |