Lebanese vs Central American Indian Births to Unmarried Women
COMPARE
Lebanese
Central American Indian
Births to Unmarried Women
Births to Unmarried Women Comparison
Lebanese
Central American Indians
29.5%
BIRTHS TO UNMARRIED WOMEN
94.4/ 100
METRIC RATING
103rd/ 347
METRIC RANK
39.0%
BIRTHS TO UNMARRIED WOMEN
0.0/ 100
METRIC RATING
306th/ 347
METRIC RANK
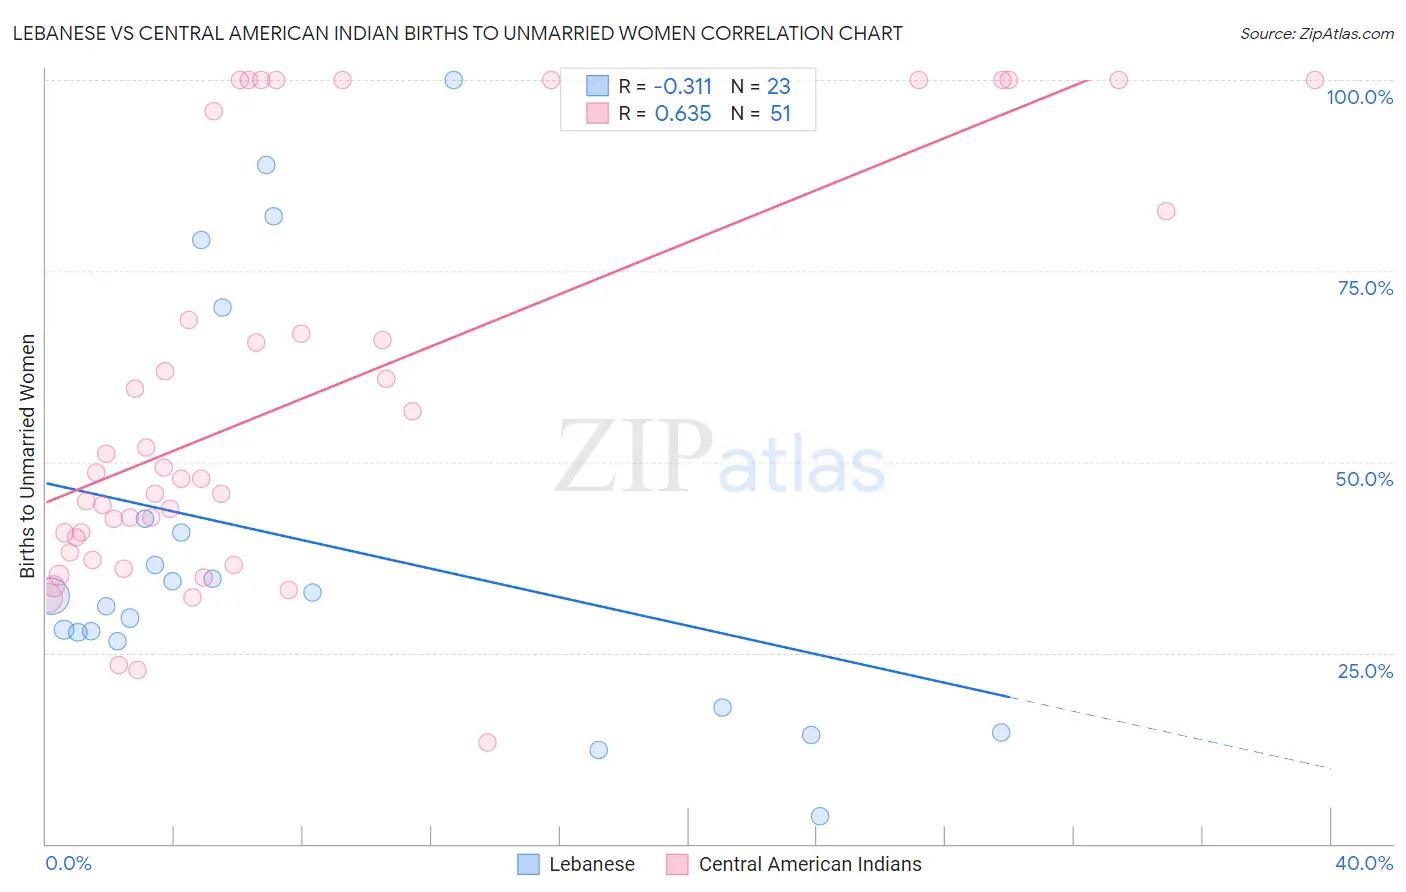
Lebanese vs Central American Indian Births to Unmarried Women Correlation Chart
The statistical analysis conducted on geographies consisting of 372,610,698 people shows a mild negative correlation between the proportion of Lebanese and percentage of births to unmarried women in the United States with a correlation coefficient (R) of -0.311 and weighted average of 29.5%. Similarly, the statistical analysis conducted on geographies consisting of 312,295,500 people shows a significant positive correlation between the proportion of Central American Indians and percentage of births to unmarried women in the United States with a correlation coefficient (R) of 0.635 and weighted average of 39.0%, a difference of 31.9%.
Births to Unmarried Women Correlation Summary
| Measurement | Lebanese | Central American Indian |
| Minimum | 3.6% | 13.2% |
| Maximum | 100.0% | 100.0% |
| Range | 96.4% | 86.8% |
| Mean | 39.5% | 58.1% |
| Median | 32.4% | 47.9% |
| Interquartile 25% (IQ1) | 26.4% | 38.2% |
| Interquartile 75% (IQ3) | 42.6% | 82.8% |
| Interquartile Range (IQR) | 16.2% | 44.6% |
| Standard Deviation (Sample) | 26.2% | 26.3% |
| Standard Deviation (Population) | 25.6% | 26.0% |
Similar Demographics by Births to Unmarried Women
Demographics Similar to Lebanese by Births to Unmarried Women
In terms of births to unmarried women, the demographic groups most similar to Lebanese are Lithuanian (29.6%, a difference of 0.010%), Australian (29.5%, a difference of 0.050%), Immigrants from Nepal (29.6%, a difference of 0.060%), Immigrants from Northern Africa (29.5%, a difference of 0.13%), and Swedish (29.6%, a difference of 0.32%).
| Demographics | Rating | Rank | Births to Unmarried Women |
| Norwegians | 95.8 /100 | #96 | Exceptional 29.3% |
| Immigrants | South Africa | 95.7 /100 | #97 | Exceptional 29.3% |
| Immigrants | Syria | 95.7 /100 | #98 | Exceptional 29.4% |
| Immigrants | Denmark | 95.3 /100 | #99 | Exceptional 29.4% |
| Luxembourgers | 95.2 /100 | #100 | Exceptional 29.4% |
| Immigrants | Northern Africa | 94.7 /100 | #101 | Exceptional 29.5% |
| Australians | 94.6 /100 | #102 | Exceptional 29.5% |
| Lebanese | 94.4 /100 | #103 | Exceptional 29.5% |
| Lithuanians | 94.4 /100 | #104 | Exceptional 29.6% |
| Immigrants | Nepal | 94.3 /100 | #105 | Exceptional 29.6% |
| Swedes | 93.8 /100 | #106 | Exceptional 29.6% |
| Immigrants | Brazil | 93.7 /100 | #107 | Exceptional 29.6% |
| Paraguayans | 93.5 /100 | #108 | Exceptional 29.7% |
| Greeks | 93.4 /100 | #109 | Exceptional 29.7% |
| Immigrants | Ethiopia | 93.4 /100 | #110 | Exceptional 29.7% |
Demographics Similar to Central American Indians by Births to Unmarried Women
In terms of births to unmarried women, the demographic groups most similar to Central American Indians are Immigrants from Haiti (38.9%, a difference of 0.29%), Yaqui (38.8%, a difference of 0.39%), Immigrants from Jamaica (38.8%, a difference of 0.44%), Honduran (38.7%, a difference of 0.76%), and Immigrants from Honduras (39.3%, a difference of 0.86%).
| Demographics | Rating | Rank | Births to Unmarried Women |
| Spanish Americans | 0.0 /100 | #299 | Tragic 38.6% |
| Immigrants | West Indies | 0.0 /100 | #300 | Tragic 38.6% |
| Haitians | 0.0 /100 | #301 | Tragic 38.6% |
| Hondurans | 0.0 /100 | #302 | Tragic 38.7% |
| Immigrants | Jamaica | 0.0 /100 | #303 | Tragic 38.8% |
| Yaqui | 0.0 /100 | #304 | Tragic 38.8% |
| Immigrants | Haiti | 0.0 /100 | #305 | Tragic 38.9% |
| Central American Indians | 0.0 /100 | #306 | Tragic 39.0% |
| Immigrants | Honduras | 0.0 /100 | #307 | Tragic 39.3% |
| Aleuts | 0.0 /100 | #308 | Tragic 39.3% |
| Cubans | 0.0 /100 | #309 | Tragic 39.4% |
| Immigrants | Dominica | 0.0 /100 | #310 | Tragic 39.5% |
| Immigrants | Azores | 0.0 /100 | #311 | Tragic 39.6% |
| U.S. Virgin Islanders | 0.0 /100 | #312 | Tragic 39.6% |
| Africans | 0.0 /100 | #313 | Tragic 39.7% |