Immigrants from Zimbabwe vs Central American Indian Median Male Earnings
COMPARE
Immigrants from Zimbabwe
Central American Indian
Median Male Earnings
Median Male Earnings Comparison
Immigrants from Zimbabwe
Central American Indians
$57,352
MEDIAN MALE EARNINGS
94.3/ 100
METRIC RATING
117th/ 347
METRIC RANK
$47,433
MEDIAN MALE EARNINGS
0.1/ 100
METRIC RATING
295th/ 347
METRIC RANK
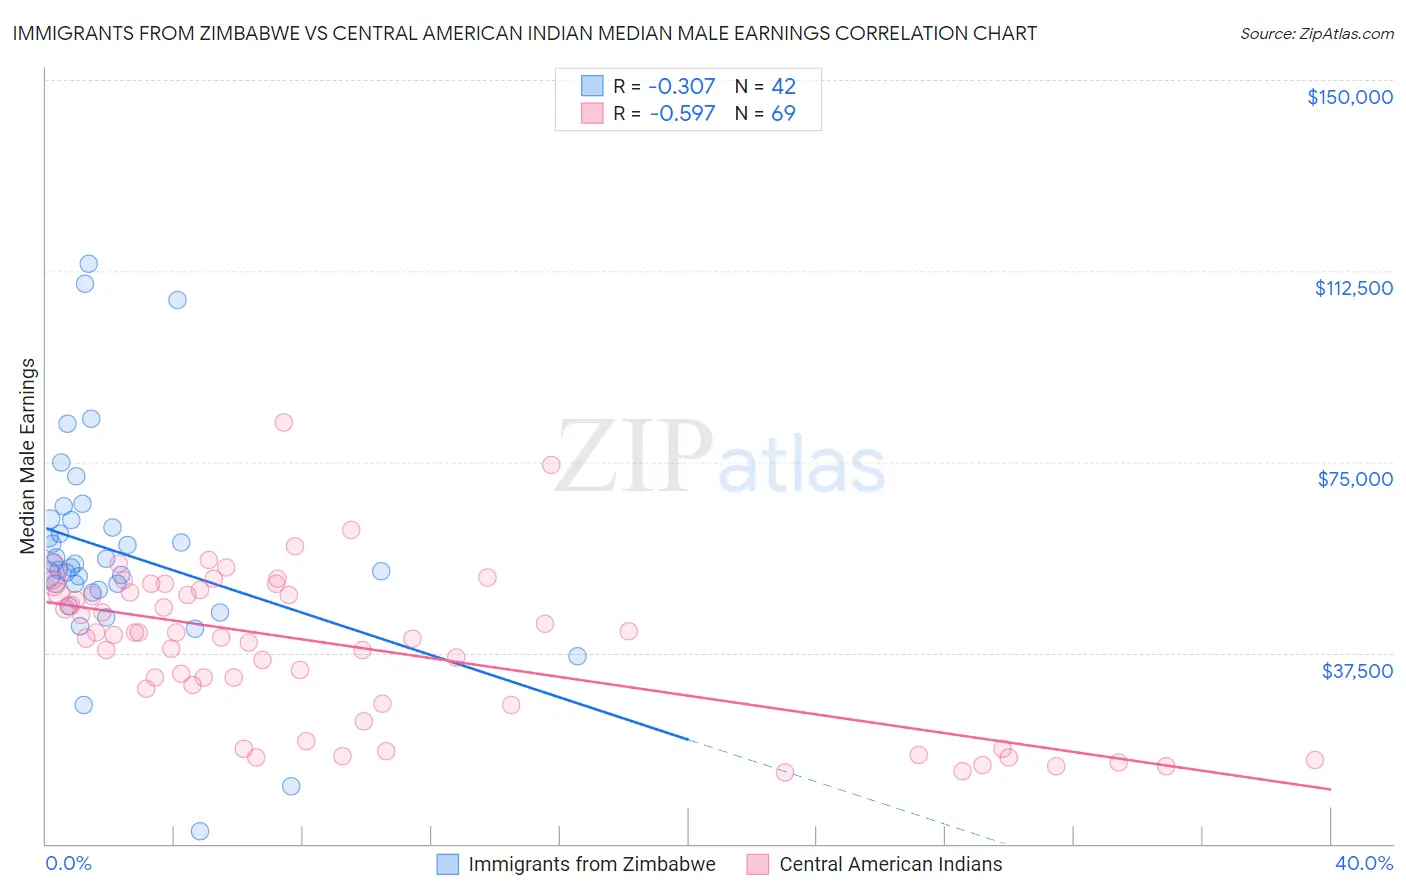
Immigrants from Zimbabwe vs Central American Indian Median Male Earnings Correlation Chart
The statistical analysis conducted on geographies consisting of 117,801,711 people shows a mild negative correlation between the proportion of Immigrants from Zimbabwe and median male earnings in the United States with a correlation coefficient (R) of -0.307 and weighted average of $57,352. Similarly, the statistical analysis conducted on geographies consisting of 326,058,906 people shows a substantial negative correlation between the proportion of Central American Indians and median male earnings in the United States with a correlation coefficient (R) of -0.597 and weighted average of $47,433, a difference of 20.9%.
Median Male Earnings Correlation Summary
| Measurement | Immigrants from Zimbabwe | Central American Indian |
| Minimum | $2,499 | $13,893 |
| Maximum | $113,981 | $82,778 |
| Range | $111,482 | $68,885 |
| Mean | $57,395 | $38,816 |
| Median | $54,601 | $41,080 |
| Interquartile 25% (IQ1) | $49,751 | $27,422 |
| Interquartile 75% (IQ3) | $63,542 | $49,572 |
| Interquartile Range (IQR) | $13,791 | $22,150 |
| Standard Deviation (Sample) | $21,107 | $15,153 |
| Standard Deviation (Population) | $20,855 | $15,043 |
Similar Demographics by Median Male Earnings
Demographics Similar to Immigrants from Zimbabwe by Median Male Earnings
In terms of median male earnings, the demographic groups most similar to Immigrants from Zimbabwe are Hungarian ($57,309, a difference of 0.080%), Arab ($57,298, a difference of 0.090%), Lebanese ($57,409, a difference of 0.10%), Canadian ($57,286, a difference of 0.12%), and Swedish ($57,445, a difference of 0.16%).
| Demographics | Rating | Rank | Median Male Earnings |
| Palestinians | 96.2 /100 | #110 | Exceptional $57,778 |
| Europeans | 95.6 /100 | #111 | Exceptional $57,637 |
| Immigrants | Afghanistan | 95.4 /100 | #112 | Exceptional $57,582 |
| Carpatho Rusyns | 95.3 /100 | #113 | Exceptional $57,572 |
| Immigrants | Kuwait | 95.3 /100 | #114 | Exceptional $57,562 |
| Swedes | 94.8 /100 | #115 | Exceptional $57,445 |
| Lebanese | 94.6 /100 | #116 | Exceptional $57,409 |
| Immigrants | Zimbabwe | 94.3 /100 | #117 | Exceptional $57,352 |
| Hungarians | 94.0 /100 | #118 | Exceptional $57,309 |
| Arabs | 94.0 /100 | #119 | Exceptional $57,298 |
| Canadians | 93.9 /100 | #120 | Exceptional $57,286 |
| Immigrants | Albania | 93.3 /100 | #121 | Exceptional $57,179 |
| Immigrants | Jordan | 93.1 /100 | #122 | Exceptional $57,145 |
| Slovenes | 93.1 /100 | #123 | Exceptional $57,145 |
| Chileans | 91.9 /100 | #124 | Exceptional $56,973 |
Demographics Similar to Central American Indians by Median Male Earnings
In terms of median male earnings, the demographic groups most similar to Central American Indians are Immigrants from Nicaragua ($47,482, a difference of 0.10%), Indonesian ($47,503, a difference of 0.15%), Inupiat ($47,281, a difference of 0.32%), Immigrants from Dominica ($47,651, a difference of 0.46%), and Dominican ($47,204, a difference of 0.48%).
| Demographics | Rating | Rank | Median Male Earnings |
| Shoshone | 0.2 /100 | #288 | Tragic $47,930 |
| Chickasaw | 0.1 /100 | #289 | Tragic $47,832 |
| Immigrants | Belize | 0.1 /100 | #290 | Tragic $47,809 |
| Choctaw | 0.1 /100 | #291 | Tragic $47,729 |
| Immigrants | Dominica | 0.1 /100 | #292 | Tragic $47,651 |
| Indonesians | 0.1 /100 | #293 | Tragic $47,503 |
| Immigrants | Nicaragua | 0.1 /100 | #294 | Tragic $47,482 |
| Central American Indians | 0.1 /100 | #295 | Tragic $47,433 |
| Inupiat | 0.1 /100 | #296 | Tragic $47,281 |
| Dominicans | 0.1 /100 | #297 | Tragic $47,204 |
| Immigrants | Micronesia | 0.1 /100 | #298 | Tragic $47,177 |
| Immigrants | Zaire | 0.1 /100 | #299 | Tragic $47,070 |
| U.S. Virgin Islanders | 0.1 /100 | #300 | Tragic $47,066 |
| Immigrants | Latin America | 0.1 /100 | #301 | Tragic $46,941 |
| Seminole | 0.1 /100 | #302 | Tragic $46,783 |