Nonimmigrants vs Central American Indian Median Male Earnings
COMPARE
Nonimmigrants
Central American Indian
Median Male Earnings
Median Male Earnings Comparison
Nonimmigrants
Central American Indians
$52,170
MEDIAN MALE EARNINGS
9.3/ 100
METRIC RATING
214th/ 347
METRIC RANK
$47,433
MEDIAN MALE EARNINGS
0.1/ 100
METRIC RATING
295th/ 347
METRIC RANK
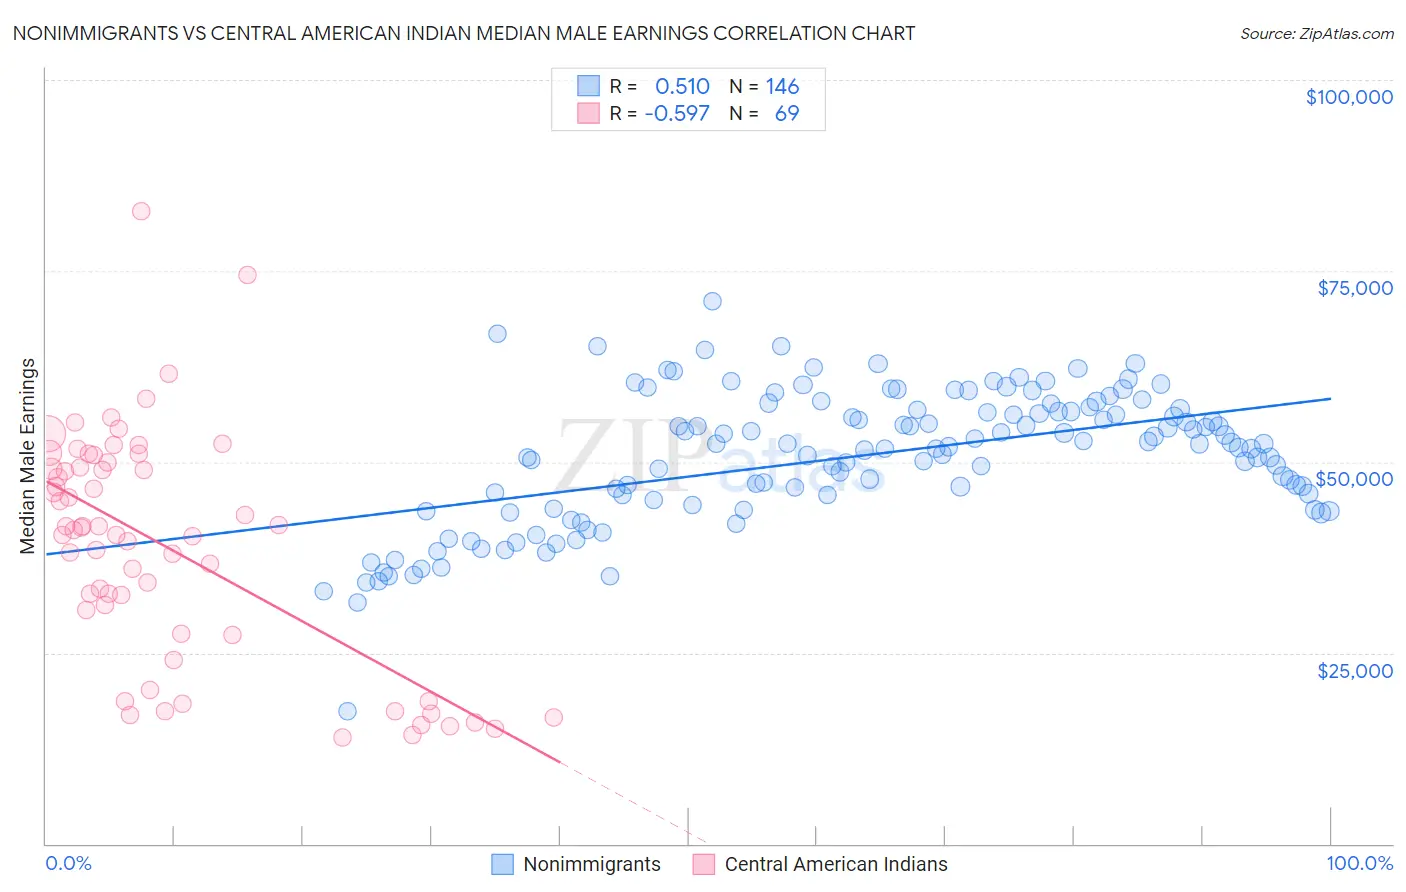
Nonimmigrants vs Central American Indian Median Male Earnings Correlation Chart
The statistical analysis conducted on geographies consisting of 582,196,653 people shows a substantial positive correlation between the proportion of Nonimmigrants and median male earnings in the United States with a correlation coefficient (R) of 0.510 and weighted average of $52,170. Similarly, the statistical analysis conducted on geographies consisting of 326,058,906 people shows a substantial negative correlation between the proportion of Central American Indians and median male earnings in the United States with a correlation coefficient (R) of -0.597 and weighted average of $47,433, a difference of 10.0%.
Median Male Earnings Correlation Summary
| Measurement | Nonimmigrants | Central American Indian |
| Minimum | $17,422 | $13,893 |
| Maximum | $71,068 | $82,778 |
| Range | $53,646 | $68,885 |
| Mean | $50,720 | $38,816 |
| Median | $52,345 | $41,080 |
| Interquartile 25% (IQ1) | $45,072 | $27,422 |
| Interquartile 75% (IQ3) | $56,800 | $49,572 |
| Interquartile Range (IQR) | $11,728 | $22,150 |
| Standard Deviation (Sample) | $8,752 | $15,153 |
| Standard Deviation (Population) | $8,722 | $15,043 |
Similar Demographics by Median Male Earnings
Demographics Similar to Nonimmigrants by Median Male Earnings
In terms of median male earnings, the demographic groups most similar to Nonimmigrants are Immigrants from Cameroon ($52,119, a difference of 0.10%), Immigrants from Venezuela ($52,041, a difference of 0.25%), Nigerian ($52,039, a difference of 0.25%), Native Hawaiian ($52,306, a difference of 0.26%), and Cajun ($52,325, a difference of 0.30%).
| Demographics | Rating | Rank | Median Male Earnings |
| Vietnamese | 12.7 /100 | #207 | Poor $52,525 |
| Venezuelans | 12.5 /100 | #208 | Poor $52,510 |
| Bermudans | 12.1 /100 | #209 | Poor $52,465 |
| Delaware | 11.5 /100 | #210 | Poor $52,412 |
| Tlingit-Haida | 11.5 /100 | #211 | Poor $52,409 |
| Cajuns | 10.7 /100 | #212 | Poor $52,325 |
| Native Hawaiians | 10.5 /100 | #213 | Poor $52,306 |
| Immigrants | Nonimmigrants | 9.3 /100 | #214 | Tragic $52,170 |
| Immigrants | Cameroon | 8.9 /100 | #215 | Tragic $52,119 |
| Immigrants | Venezuela | 8.3 /100 | #216 | Tragic $52,041 |
| Nigerians | 8.3 /100 | #217 | Tragic $52,039 |
| Immigrants | Panama | 7.7 /100 | #218 | Tragic $51,962 |
| Immigrants | Ghana | 6.9 /100 | #219 | Tragic $51,836 |
| Immigrants | Armenia | 6.6 /100 | #220 | Tragic $51,793 |
| Immigrants | Senegal | 5.8 /100 | #221 | Tragic $51,647 |
Demographics Similar to Central American Indians by Median Male Earnings
In terms of median male earnings, the demographic groups most similar to Central American Indians are Immigrants from Nicaragua ($47,482, a difference of 0.10%), Indonesian ($47,503, a difference of 0.15%), Inupiat ($47,281, a difference of 0.32%), Immigrants from Dominica ($47,651, a difference of 0.46%), and Dominican ($47,204, a difference of 0.48%).
| Demographics | Rating | Rank | Median Male Earnings |
| Shoshone | 0.2 /100 | #288 | Tragic $47,930 |
| Chickasaw | 0.1 /100 | #289 | Tragic $47,832 |
| Immigrants | Belize | 0.1 /100 | #290 | Tragic $47,809 |
| Choctaw | 0.1 /100 | #291 | Tragic $47,729 |
| Immigrants | Dominica | 0.1 /100 | #292 | Tragic $47,651 |
| Indonesians | 0.1 /100 | #293 | Tragic $47,503 |
| Immigrants | Nicaragua | 0.1 /100 | #294 | Tragic $47,482 |
| Central American Indians | 0.1 /100 | #295 | Tragic $47,433 |
| Inupiat | 0.1 /100 | #296 | Tragic $47,281 |
| Dominicans | 0.1 /100 | #297 | Tragic $47,204 |
| Immigrants | Micronesia | 0.1 /100 | #298 | Tragic $47,177 |
| Immigrants | Zaire | 0.1 /100 | #299 | Tragic $47,070 |
| U.S. Virgin Islanders | 0.1 /100 | #300 | Tragic $47,066 |
| Immigrants | Latin America | 0.1 /100 | #301 | Tragic $46,941 |
| Seminole | 0.1 /100 | #302 | Tragic $46,783 |