Swiss vs Central American Indian Median Male Earnings
COMPARE
Swiss
Central American Indian
Median Male Earnings
Median Male Earnings Comparison
Swiss
Central American Indians
$55,731
MEDIAN MALE EARNINGS
77.1/ 100
METRIC RATING
150th/ 347
METRIC RANK
$47,433
MEDIAN MALE EARNINGS
0.1/ 100
METRIC RATING
295th/ 347
METRIC RANK
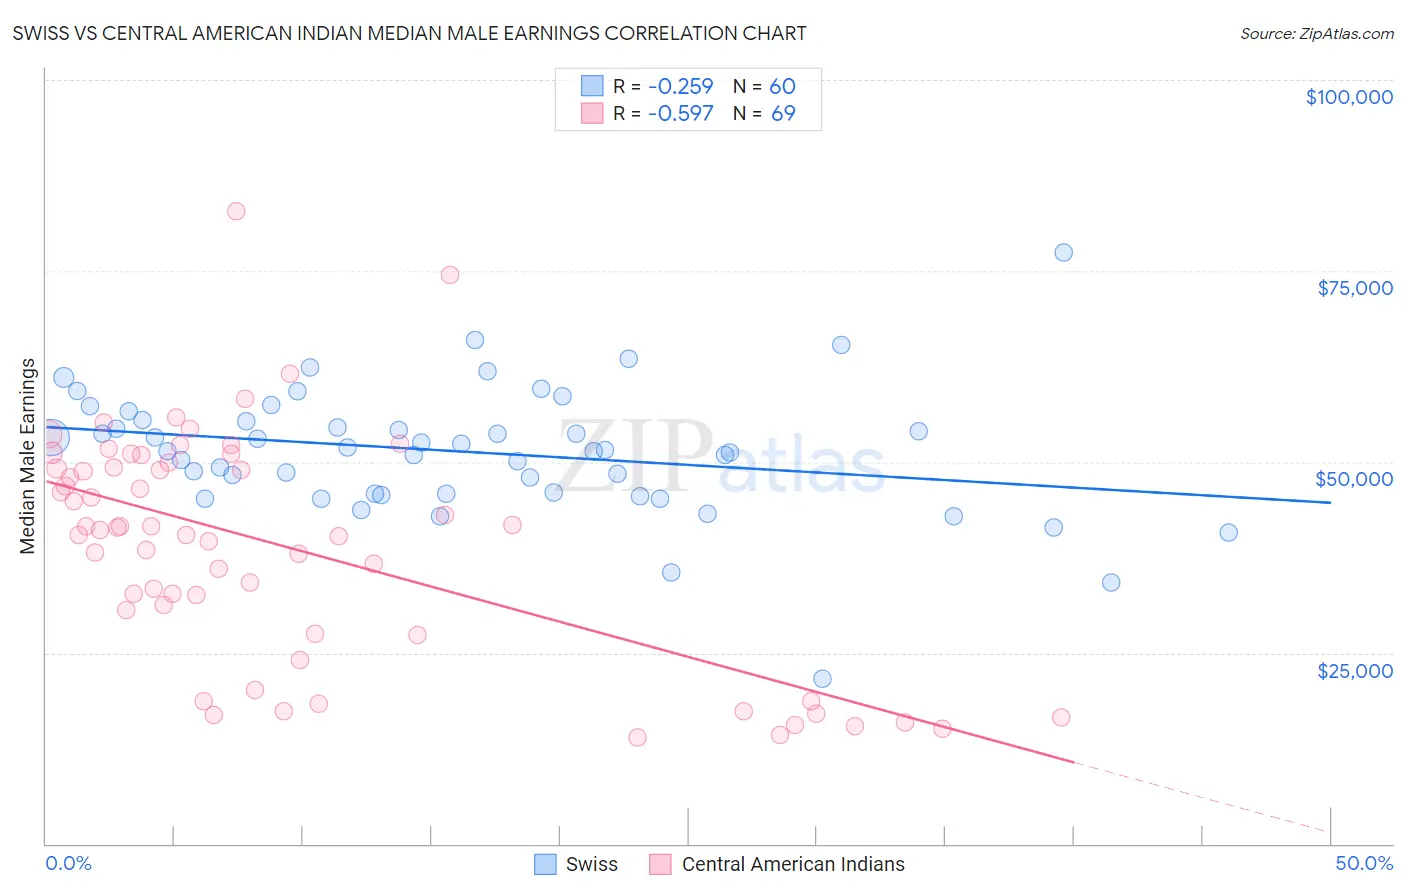
Swiss vs Central American Indian Median Male Earnings Correlation Chart
The statistical analysis conducted on geographies consisting of 464,659,146 people shows a weak negative correlation between the proportion of Swiss and median male earnings in the United States with a correlation coefficient (R) of -0.259 and weighted average of $55,731. Similarly, the statistical analysis conducted on geographies consisting of 326,058,906 people shows a substantial negative correlation between the proportion of Central American Indians and median male earnings in the United States with a correlation coefficient (R) of -0.597 and weighted average of $47,433, a difference of 17.5%.
Median Male Earnings Correlation Summary
| Measurement | Swiss | Central American Indian |
| Minimum | $21,563 | $13,893 |
| Maximum | $77,386 | $82,778 |
| Range | $55,823 | $68,885 |
| Mean | $51,336 | $38,816 |
| Median | $51,444 | $41,080 |
| Interquartile 25% (IQ1) | $45,855 | $27,422 |
| Interquartile 75% (IQ3) | $55,388 | $49,572 |
| Interquartile Range (IQR) | $9,533 | $22,150 |
| Standard Deviation (Sample) | $8,461 | $15,153 |
| Standard Deviation (Population) | $8,390 | $15,043 |
Similar Demographics by Median Male Earnings
Demographics Similar to Swiss by Median Male Earnings
In terms of median male earnings, the demographic groups most similar to Swiss are English ($55,747, a difference of 0.030%), Immigrants from Oceania ($55,712, a difference of 0.030%), Scottish ($55,793, a difference of 0.11%), Peruvian ($55,659, a difference of 0.13%), and Immigrants from Philippines ($55,809, a difference of 0.14%).
| Demographics | Rating | Rank | Median Male Earnings |
| Sri Lankans | 83.4 /100 | #143 | Excellent $56,136 |
| Immigrants | Uganda | 82.4 /100 | #144 | Excellent $56,064 |
| Norwegians | 80.9 /100 | #145 | Excellent $55,965 |
| Immigrants | Chile | 80.7 /100 | #146 | Excellent $55,954 |
| Immigrants | Philippines | 78.4 /100 | #147 | Good $55,809 |
| Scottish | 78.2 /100 | #148 | Good $55,793 |
| English | 77.4 /100 | #149 | Good $55,747 |
| Swiss | 77.1 /100 | #150 | Good $55,731 |
| Immigrants | Oceania | 76.8 /100 | #151 | Good $55,712 |
| Peruvians | 75.8 /100 | #152 | Good $55,659 |
| Immigrants | Nepal | 75.0 /100 | #153 | Good $55,615 |
| Taiwanese | 73.9 /100 | #154 | Good $55,556 |
| Scandinavians | 73.4 /100 | #155 | Good $55,527 |
| Immigrants | Ethiopia | 71.6 /100 | #156 | Good $55,434 |
| Icelanders | 71.2 /100 | #157 | Good $55,415 |
Demographics Similar to Central American Indians by Median Male Earnings
In terms of median male earnings, the demographic groups most similar to Central American Indians are Immigrants from Nicaragua ($47,482, a difference of 0.10%), Indonesian ($47,503, a difference of 0.15%), Inupiat ($47,281, a difference of 0.32%), Immigrants from Dominica ($47,651, a difference of 0.46%), and Dominican ($47,204, a difference of 0.48%).
| Demographics | Rating | Rank | Median Male Earnings |
| Shoshone | 0.2 /100 | #288 | Tragic $47,930 |
| Chickasaw | 0.1 /100 | #289 | Tragic $47,832 |
| Immigrants | Belize | 0.1 /100 | #290 | Tragic $47,809 |
| Choctaw | 0.1 /100 | #291 | Tragic $47,729 |
| Immigrants | Dominica | 0.1 /100 | #292 | Tragic $47,651 |
| Indonesians | 0.1 /100 | #293 | Tragic $47,503 |
| Immigrants | Nicaragua | 0.1 /100 | #294 | Tragic $47,482 |
| Central American Indians | 0.1 /100 | #295 | Tragic $47,433 |
| Inupiat | 0.1 /100 | #296 | Tragic $47,281 |
| Dominicans | 0.1 /100 | #297 | Tragic $47,204 |
| Immigrants | Micronesia | 0.1 /100 | #298 | Tragic $47,177 |
| Immigrants | Zaire | 0.1 /100 | #299 | Tragic $47,070 |
| U.S. Virgin Islanders | 0.1 /100 | #300 | Tragic $47,066 |
| Immigrants | Latin America | 0.1 /100 | #301 | Tragic $46,941 |
| Seminole | 0.1 /100 | #302 | Tragic $46,783 |