Kenyan vs Chilean Median Female Earnings
COMPARE
Kenyan
Chilean
Median Female Earnings
Median Female Earnings Comparison
Kenyans
Chileans
$39,860
MEDIAN FEMALE EARNINGS
58.4/ 100
METRIC RATING
169th/ 347
METRIC RANK
$40,757
MEDIAN FEMALE EARNINGS
90.0/ 100
METRIC RATING
131st/ 347
METRIC RANK
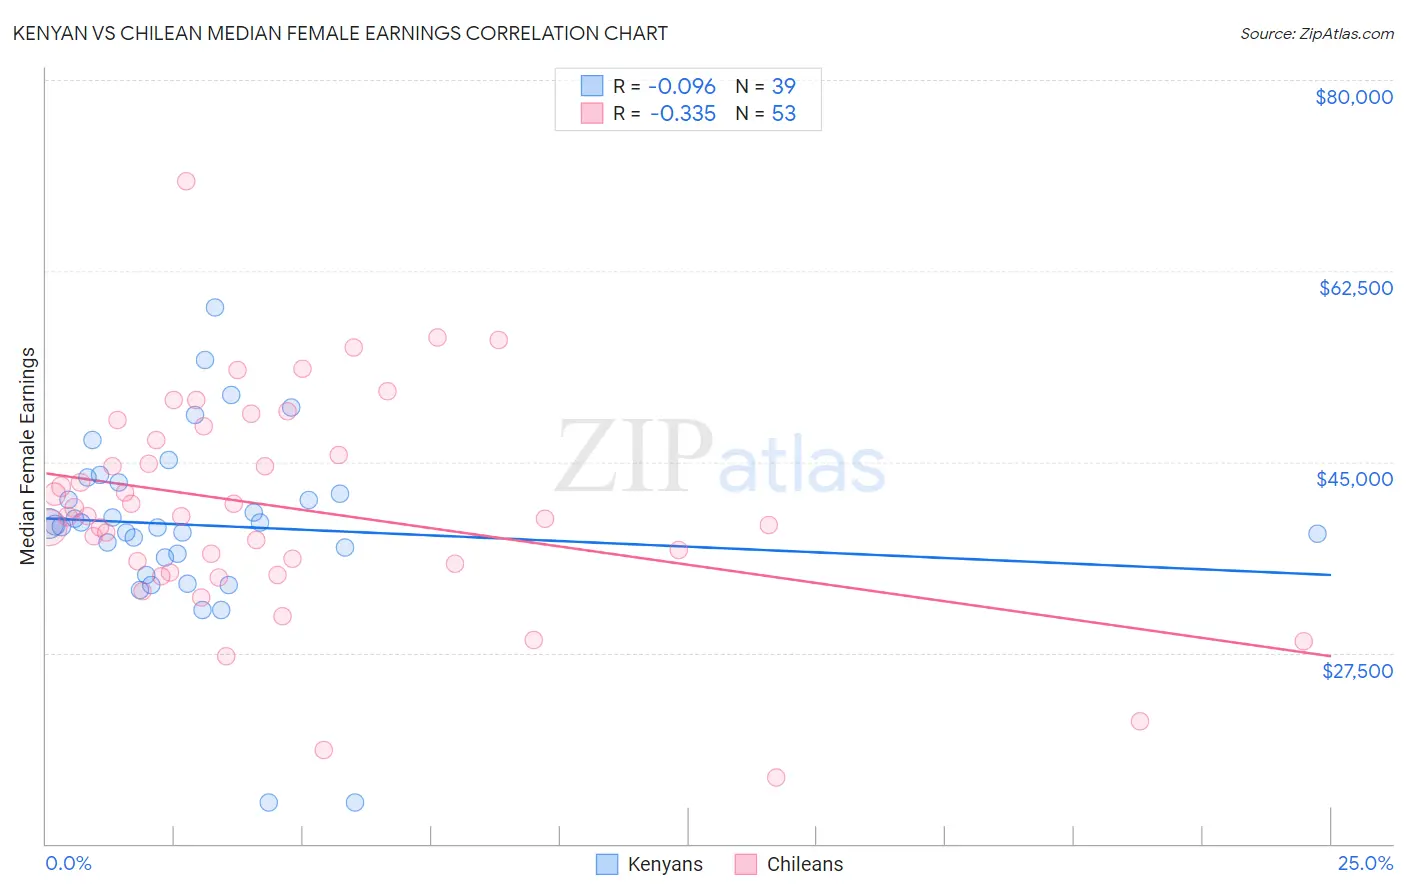
Kenyan vs Chilean Median Female Earnings Correlation Chart
The statistical analysis conducted on geographies consisting of 168,237,877 people shows a slight negative correlation between the proportion of Kenyans and median female earnings in the United States with a correlation coefficient (R) of -0.096 and weighted average of $39,860. Similarly, the statistical analysis conducted on geographies consisting of 256,655,155 people shows a mild negative correlation between the proportion of Chileans and median female earnings in the United States with a correlation coefficient (R) of -0.335 and weighted average of $40,757, a difference of 2.2%.
Median Female Earnings Correlation Summary
| Measurement | Kenyan | Chilean |
| Minimum | $13,750 | $16,042 |
| Maximum | $59,125 | $70,707 |
| Range | $45,375 | $54,665 |
| Mean | $39,183 | $40,800 |
| Median | $39,212 | $39,990 |
| Interquartile 25% (IQ1) | $36,279 | $35,267 |
| Interquartile 75% (IQ3) | $43,131 | $47,653 |
| Interquartile Range (IQR) | $6,851 | $12,386 |
| Standard Deviation (Sample) | $8,498 | $9,907 |
| Standard Deviation (Population) | $8,388 | $9,813 |
Similar Demographics by Median Female Earnings
Demographics Similar to Kenyans by Median Female Earnings
In terms of median female earnings, the demographic groups most similar to Kenyans are Immigrants from Peru ($39,871, a difference of 0.030%), Immigrants from Ghana ($39,894, a difference of 0.080%), Luxembourger ($39,891, a difference of 0.080%), Slovene ($39,817, a difference of 0.11%), and Immigrants from Bangladesh ($39,910, a difference of 0.12%).
| Demographics | Rating | Rank | Median Female Earnings |
| South American Indians | 66.1 /100 | #162 | Good $40,019 |
| Lebanese | 65.5 /100 | #163 | Good $40,006 |
| Immigrants | Saudi Arabia | 62.9 /100 | #164 | Good $39,952 |
| Immigrants | Bangladesh | 60.8 /100 | #165 | Good $39,910 |
| Immigrants | Ghana | 60.0 /100 | #166 | Good $39,894 |
| Luxembourgers | 59.9 /100 | #167 | Average $39,891 |
| Immigrants | Peru | 58.9 /100 | #168 | Average $39,871 |
| Kenyans | 58.4 /100 | #169 | Average $39,860 |
| Slovenes | 56.2 /100 | #170 | Average $39,817 |
| Immigrants | Portugal | 54.7 /100 | #171 | Average $39,788 |
| British | 53.8 /100 | #172 | Average $39,772 |
| Canadians | 51.4 /100 | #173 | Average $39,724 |
| South Americans | 50.0 /100 | #174 | Average $39,698 |
| Immigrants | South America | 47.2 /100 | #175 | Average $39,643 |
| Nigerians | 47.0 /100 | #176 | Average $39,641 |
Demographics Similar to Chileans by Median Female Earnings
In terms of median female earnings, the demographic groups most similar to Chileans are Immigrants from Guyana ($40,773, a difference of 0.040%), Immigrants from Uganda ($40,739, a difference of 0.040%), Syrian ($40,727, a difference of 0.070%), Zimbabwean ($40,798, a difference of 0.10%), and Arab ($40,718, a difference of 0.10%).
| Demographics | Rating | Rank | Median Female Earnings |
| Trinidadians and Tobagonians | 93.2 /100 | #124 | Exceptional $40,958 |
| Austrians | 92.7 /100 | #125 | Exceptional $40,923 |
| Immigrants | Trinidad and Tobago | 92.3 /100 | #126 | Exceptional $40,895 |
| Ugandans | 92.2 /100 | #127 | Exceptional $40,889 |
| Carpatho Rusyns | 91.2 /100 | #128 | Exceptional $40,825 |
| Zimbabweans | 90.8 /100 | #129 | Exceptional $40,798 |
| Immigrants | Guyana | 90.3 /100 | #130 | Exceptional $40,773 |
| Chileans | 90.0 /100 | #131 | Exceptional $40,757 |
| Immigrants | Uganda | 89.7 /100 | #132 | Excellent $40,739 |
| Syrians | 89.5 /100 | #133 | Excellent $40,727 |
| Arabs | 89.3 /100 | #134 | Excellent $40,718 |
| Immigrants | Nepal | 89.0 /100 | #135 | Excellent $40,704 |
| Immigrants | Eastern Africa | 87.7 /100 | #136 | Excellent $40,644 |
| Pakistanis | 86.6 /100 | #137 | Excellent $40,596 |
| Taiwanese | 86.1 /100 | #138 | Excellent $40,576 |