Kenyan vs Tohono O'odham Median Female Earnings
COMPARE
Kenyan
Tohono O'odham
Median Female Earnings
Median Female Earnings Comparison
Kenyans
Tohono O'odham
$39,860
MEDIAN FEMALE EARNINGS
58.4/ 100
METRIC RATING
169th/ 347
METRIC RANK
$33,205
MEDIAN FEMALE EARNINGS
0.0/ 100
METRIC RATING
340th/ 347
METRIC RANK
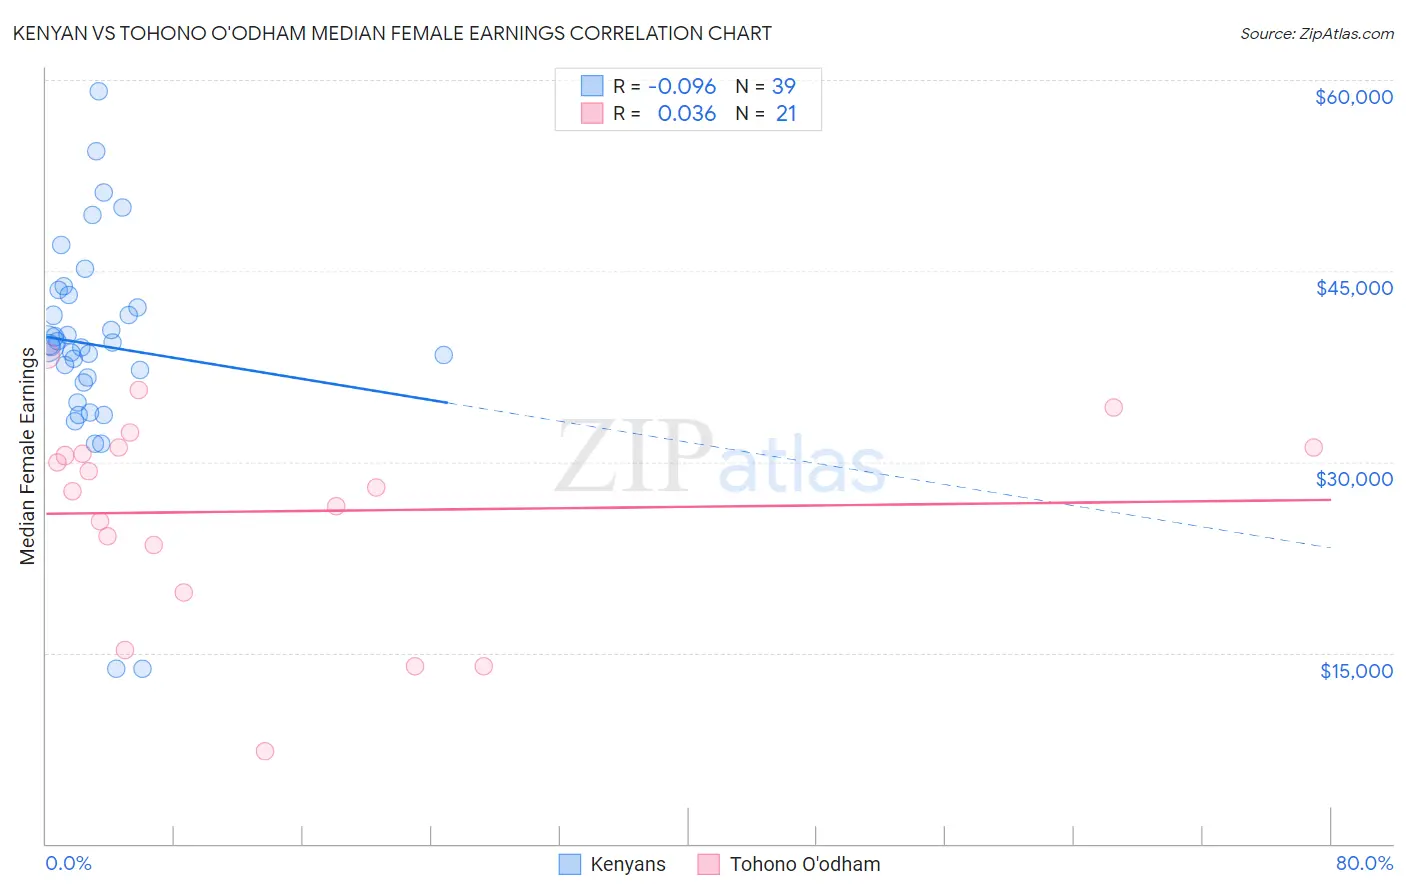
Kenyan vs Tohono O'odham Median Female Earnings Correlation Chart
The statistical analysis conducted on geographies consisting of 168,237,877 people shows a slight negative correlation between the proportion of Kenyans and median female earnings in the United States with a correlation coefficient (R) of -0.096 and weighted average of $39,860. Similarly, the statistical analysis conducted on geographies consisting of 58,716,616 people shows no correlation between the proportion of Tohono O'odham and median female earnings in the United States with a correlation coefficient (R) of 0.036 and weighted average of $33,205, a difference of 20.0%.
Median Female Earnings Correlation Summary
| Measurement | Kenyan | Tohono O'odham |
| Minimum | $13,750 | $7,287 |
| Maximum | $59,125 | $38,345 |
| Range | $45,375 | $31,058 |
| Mean | $39,183 | $26,118 |
| Median | $39,212 | $28,033 |
| Interquartile 25% (IQ1) | $36,279 | $21,596 |
| Interquartile 75% (IQ3) | $43,131 | $31,136 |
| Interquartile Range (IQR) | $6,851 | $9,540 |
| Standard Deviation (Sample) | $8,498 | $8,020 |
| Standard Deviation (Population) | $8,388 | $7,826 |
Similar Demographics by Median Female Earnings
Demographics Similar to Kenyans by Median Female Earnings
In terms of median female earnings, the demographic groups most similar to Kenyans are Immigrants from Peru ($39,871, a difference of 0.030%), Immigrants from Ghana ($39,894, a difference of 0.080%), Luxembourger ($39,891, a difference of 0.080%), Slovene ($39,817, a difference of 0.11%), and Immigrants from Bangladesh ($39,910, a difference of 0.12%).
| Demographics | Rating | Rank | Median Female Earnings |
| South American Indians | 66.1 /100 | #162 | Good $40,019 |
| Lebanese | 65.5 /100 | #163 | Good $40,006 |
| Immigrants | Saudi Arabia | 62.9 /100 | #164 | Good $39,952 |
| Immigrants | Bangladesh | 60.8 /100 | #165 | Good $39,910 |
| Immigrants | Ghana | 60.0 /100 | #166 | Good $39,894 |
| Luxembourgers | 59.9 /100 | #167 | Average $39,891 |
| Immigrants | Peru | 58.9 /100 | #168 | Average $39,871 |
| Kenyans | 58.4 /100 | #169 | Average $39,860 |
| Slovenes | 56.2 /100 | #170 | Average $39,817 |
| Immigrants | Portugal | 54.7 /100 | #171 | Average $39,788 |
| British | 53.8 /100 | #172 | Average $39,772 |
| Canadians | 51.4 /100 | #173 | Average $39,724 |
| South Americans | 50.0 /100 | #174 | Average $39,698 |
| Immigrants | South America | 47.2 /100 | #175 | Average $39,643 |
| Nigerians | 47.0 /100 | #176 | Average $39,641 |
Demographics Similar to Tohono O'odham by Median Female Earnings
In terms of median female earnings, the demographic groups most similar to Tohono O'odham are Immigrants from Mexico ($33,236, a difference of 0.090%), Immigrants from Cuba ($33,291, a difference of 0.26%), Yakama ($33,354, a difference of 0.45%), Navajo ($33,046, a difference of 0.48%), and Ottawa ($33,378, a difference of 0.52%).
| Demographics | Rating | Rank | Median Female Earnings |
| Mexicans | 0.0 /100 | #333 | Tragic $33,664 |
| Spanish American Indians | 0.0 /100 | #334 | Tragic $33,625 |
| Creek | 0.0 /100 | #335 | Tragic $33,437 |
| Ottawa | 0.0 /100 | #336 | Tragic $33,378 |
| Yakama | 0.0 /100 | #337 | Tragic $33,354 |
| Immigrants | Cuba | 0.0 /100 | #338 | Tragic $33,291 |
| Immigrants | Mexico | 0.0 /100 | #339 | Tragic $33,236 |
| Tohono O'odham | 0.0 /100 | #340 | Tragic $33,205 |
| Navajo | 0.0 /100 | #341 | Tragic $33,046 |
| Yup'ik | 0.0 /100 | #342 | Tragic $32,730 |
| Pueblo | 0.0 /100 | #343 | Tragic $32,564 |
| Lumbee | 0.0 /100 | #344 | Tragic $32,500 |
| Puerto Ricans | 0.0 /100 | #345 | Tragic $31,560 |
| Arapaho | 0.0 /100 | #346 | Tragic $31,489 |
| Houma | 0.0 /100 | #347 | Tragic $30,343 |