Kenyan vs Immigrants from St. Vincent and the Grenadines Median Female Earnings
COMPARE
Kenyan
Immigrants from St. Vincent and the Grenadines
Median Female Earnings
Median Female Earnings Comparison
Kenyans
Immigrants from St. Vincent and the Grenadines
$39,860
MEDIAN FEMALE EARNINGS
58.4/ 100
METRIC RATING
169th/ 347
METRIC RANK
$42,108
MEDIAN FEMALE EARNINGS
99.3/ 100
METRIC RATING
86th/ 347
METRIC RANK
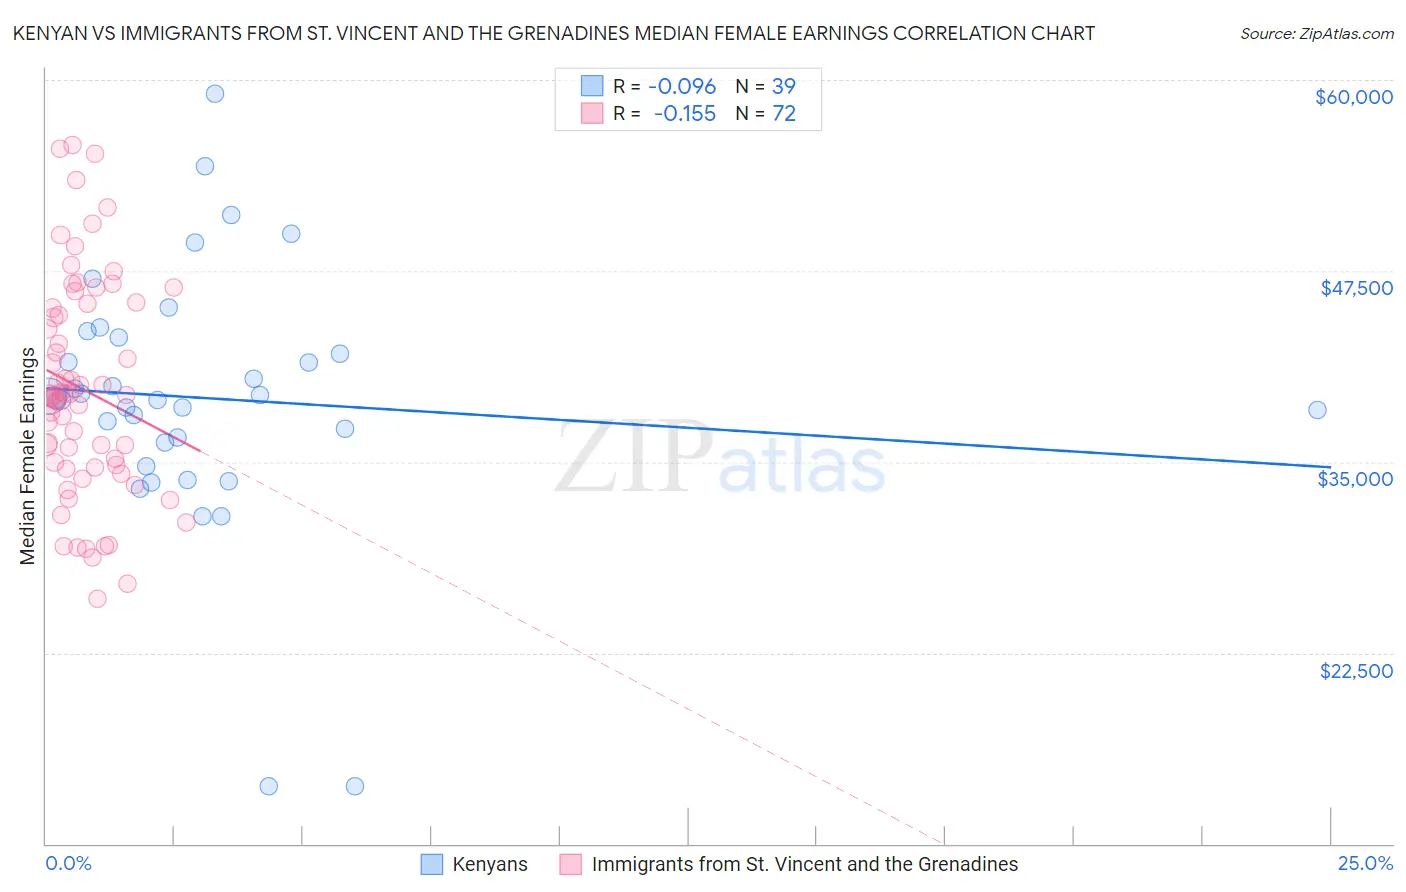
Kenyan vs Immigrants from St. Vincent and the Grenadines Median Female Earnings Correlation Chart
The statistical analysis conducted on geographies consisting of 168,237,877 people shows a slight negative correlation between the proportion of Kenyans and median female earnings in the United States with a correlation coefficient (R) of -0.096 and weighted average of $39,860. Similarly, the statistical analysis conducted on geographies consisting of 56,186,609 people shows a poor negative correlation between the proportion of Immigrants from St. Vincent and the Grenadines and median female earnings in the United States with a correlation coefficient (R) of -0.155 and weighted average of $42,108, a difference of 5.6%.
Median Female Earnings Correlation Summary
| Measurement | Kenyan | Immigrants from St. Vincent and the Grenadines |
| Minimum | $13,750 | $26,069 |
| Maximum | $59,125 | $55,714 |
| Range | $45,375 | $29,645 |
| Mean | $39,183 | $39,753 |
| Median | $39,212 | $39,381 |
| Interquartile 25% (IQ1) | $36,279 | $34,722 |
| Interquartile 75% (IQ3) | $43,131 | $45,227 |
| Interquartile Range (IQR) | $6,851 | $10,505 |
| Standard Deviation (Sample) | $8,498 | $7,078 |
| Standard Deviation (Population) | $8,388 | $7,029 |
Similar Demographics by Median Female Earnings
Demographics Similar to Kenyans by Median Female Earnings
In terms of median female earnings, the demographic groups most similar to Kenyans are Immigrants from Peru ($39,871, a difference of 0.030%), Immigrants from Ghana ($39,894, a difference of 0.080%), Luxembourger ($39,891, a difference of 0.080%), Slovene ($39,817, a difference of 0.11%), and Immigrants from Bangladesh ($39,910, a difference of 0.12%).
| Demographics | Rating | Rank | Median Female Earnings |
| South American Indians | 66.1 /100 | #162 | Good $40,019 |
| Lebanese | 65.5 /100 | #163 | Good $40,006 |
| Immigrants | Saudi Arabia | 62.9 /100 | #164 | Good $39,952 |
| Immigrants | Bangladesh | 60.8 /100 | #165 | Good $39,910 |
| Immigrants | Ghana | 60.0 /100 | #166 | Good $39,894 |
| Luxembourgers | 59.9 /100 | #167 | Average $39,891 |
| Immigrants | Peru | 58.9 /100 | #168 | Average $39,871 |
| Kenyans | 58.4 /100 | #169 | Average $39,860 |
| Slovenes | 56.2 /100 | #170 | Average $39,817 |
| Immigrants | Portugal | 54.7 /100 | #171 | Average $39,788 |
| British | 53.8 /100 | #172 | Average $39,772 |
| Canadians | 51.4 /100 | #173 | Average $39,724 |
| South Americans | 50.0 /100 | #174 | Average $39,698 |
| Immigrants | South America | 47.2 /100 | #175 | Average $39,643 |
| Nigerians | 47.0 /100 | #176 | Average $39,641 |
Demographics Similar to Immigrants from St. Vincent and the Grenadines by Median Female Earnings
In terms of median female earnings, the demographic groups most similar to Immigrants from St. Vincent and the Grenadines are Lithuanian ($42,108, a difference of 0.0%), Laotian ($42,133, a difference of 0.060%), Immigrants from Northern Africa ($42,084, a difference of 0.060%), Immigrants from Afghanistan ($42,055, a difference of 0.13%), and Ukrainian ($42,015, a difference of 0.22%).
| Demographics | Rating | Rank | Median Female Earnings |
| Greeks | 99.6 /100 | #79 | Exceptional $42,336 |
| Immigrants | Moldova | 99.6 /100 | #80 | Exceptional $42,304 |
| Immigrants | Southern Europe | 99.5 /100 | #81 | Exceptional $42,275 |
| Immigrants | Morocco | 99.5 /100 | #82 | Exceptional $42,229 |
| Immigrants | Sierra Leone | 99.5 /100 | #83 | Exceptional $42,214 |
| Armenians | 99.5 /100 | #84 | Exceptional $42,212 |
| Laotians | 99.4 /100 | #85 | Exceptional $42,133 |
| Immigrants | St. Vincent and the Grenadines | 99.3 /100 | #86 | Exceptional $42,108 |
| Lithuanians | 99.3 /100 | #87 | Exceptional $42,108 |
| Immigrants | Northern Africa | 99.3 /100 | #88 | Exceptional $42,084 |
| Immigrants | Afghanistan | 99.3 /100 | #89 | Exceptional $42,055 |
| Ukrainians | 99.2 /100 | #90 | Exceptional $42,015 |
| Immigrants | Western Europe | 99.2 /100 | #91 | Exceptional $41,990 |
| Argentineans | 99.1 /100 | #92 | Exceptional $41,952 |
| Immigrants | Grenada | 99.0 /100 | #93 | Exceptional $41,932 |