Kenyan vs Cherokee Median Female Earnings
COMPARE
Kenyan
Cherokee
Median Female Earnings
Median Female Earnings Comparison
Kenyans
Cherokee
$39,860
MEDIAN FEMALE EARNINGS
58.4/ 100
METRIC RATING
169th/ 347
METRIC RANK
$34,742
MEDIAN FEMALE EARNINGS
0.0/ 100
METRIC RATING
316th/ 347
METRIC RANK
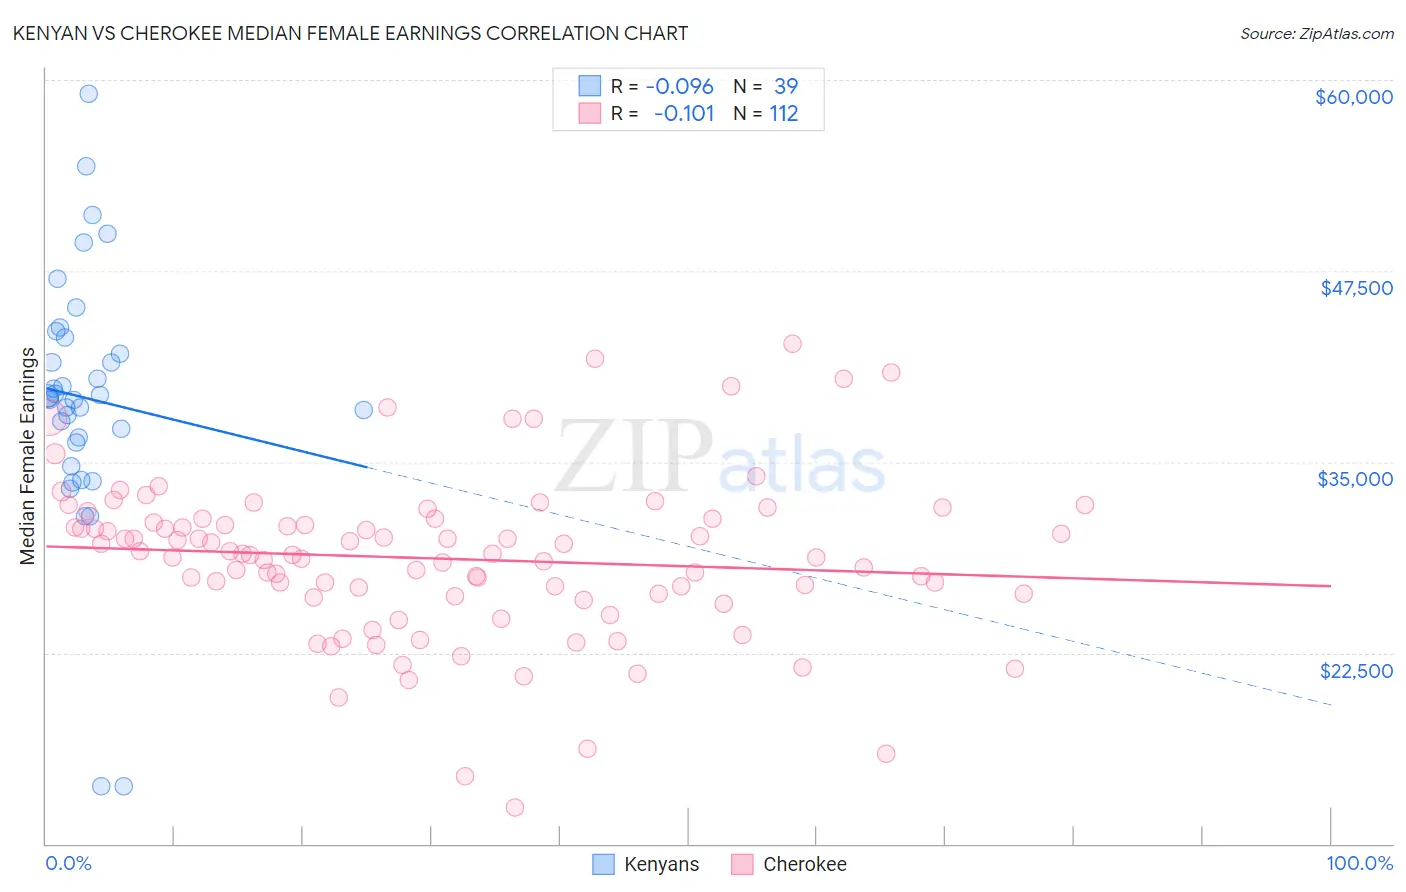
Kenyan vs Cherokee Median Female Earnings Correlation Chart
The statistical analysis conducted on geographies consisting of 168,237,877 people shows a slight negative correlation between the proportion of Kenyans and median female earnings in the United States with a correlation coefficient (R) of -0.096 and weighted average of $39,860. Similarly, the statistical analysis conducted on geographies consisting of 492,961,195 people shows a poor negative correlation between the proportion of Cherokee and median female earnings in the United States with a correlation coefficient (R) of -0.101 and weighted average of $34,742, a difference of 14.7%.
Median Female Earnings Correlation Summary
| Measurement | Kenyan | Cherokee |
| Minimum | $13,750 | $12,396 |
| Maximum | $59,125 | $42,750 |
| Range | $45,375 | $30,354 |
| Mean | $39,183 | $28,662 |
| Median | $39,212 | $28,960 |
| Interquartile 25% (IQ1) | $36,279 | $26,268 |
| Interquartile 75% (IQ3) | $43,131 | $31,156 |
| Interquartile Range (IQR) | $6,851 | $4,888 |
| Standard Deviation (Sample) | $8,498 | $5,298 |
| Standard Deviation (Population) | $8,388 | $5,275 |
Similar Demographics by Median Female Earnings
Demographics Similar to Kenyans by Median Female Earnings
In terms of median female earnings, the demographic groups most similar to Kenyans are Immigrants from Peru ($39,871, a difference of 0.030%), Immigrants from Ghana ($39,894, a difference of 0.080%), Luxembourger ($39,891, a difference of 0.080%), Slovene ($39,817, a difference of 0.11%), and Immigrants from Bangladesh ($39,910, a difference of 0.12%).
| Demographics | Rating | Rank | Median Female Earnings |
| South American Indians | 66.1 /100 | #162 | Good $40,019 |
| Lebanese | 65.5 /100 | #163 | Good $40,006 |
| Immigrants | Saudi Arabia | 62.9 /100 | #164 | Good $39,952 |
| Immigrants | Bangladesh | 60.8 /100 | #165 | Good $39,910 |
| Immigrants | Ghana | 60.0 /100 | #166 | Good $39,894 |
| Luxembourgers | 59.9 /100 | #167 | Average $39,891 |
| Immigrants | Peru | 58.9 /100 | #168 | Average $39,871 |
| Kenyans | 58.4 /100 | #169 | Average $39,860 |
| Slovenes | 56.2 /100 | #170 | Average $39,817 |
| Immigrants | Portugal | 54.7 /100 | #171 | Average $39,788 |
| British | 53.8 /100 | #172 | Average $39,772 |
| Canadians | 51.4 /100 | #173 | Average $39,724 |
| South Americans | 50.0 /100 | #174 | Average $39,698 |
| Immigrants | South America | 47.2 /100 | #175 | Average $39,643 |
| Nigerians | 47.0 /100 | #176 | Average $39,641 |
Demographics Similar to Cherokee by Median Female Earnings
In terms of median female earnings, the demographic groups most similar to Cherokee are Potawatomi ($34,739, a difference of 0.010%), Immigrants from Yemen ($34,693, a difference of 0.14%), Pennsylvania German ($34,802, a difference of 0.17%), Shoshone ($34,677, a difference of 0.19%), and Immigrants from Honduras ($34,647, a difference of 0.27%).
| Demographics | Rating | Rank | Median Female Earnings |
| Hondurans | 0.0 /100 | #309 | Tragic $35,013 |
| Chippewa | 0.0 /100 | #310 | Tragic $35,003 |
| Ute | 0.0 /100 | #311 | Tragic $34,960 |
| Yaqui | 0.0 /100 | #312 | Tragic $34,943 |
| Cubans | 0.0 /100 | #313 | Tragic $34,942 |
| Apache | 0.0 /100 | #314 | Tragic $34,895 |
| Pennsylvania Germans | 0.0 /100 | #315 | Tragic $34,802 |
| Cherokee | 0.0 /100 | #316 | Tragic $34,742 |
| Potawatomi | 0.0 /100 | #317 | Tragic $34,739 |
| Immigrants | Yemen | 0.0 /100 | #318 | Tragic $34,693 |
| Shoshone | 0.0 /100 | #319 | Tragic $34,677 |
| Immigrants | Honduras | 0.0 /100 | #320 | Tragic $34,647 |
| Hispanics or Latinos | 0.0 /100 | #321 | Tragic $34,421 |
| Chickasaw | 0.0 /100 | #322 | Tragic $34,414 |
| Seminole | 0.0 /100 | #323 | Tragic $34,385 |