Jamaican vs Immigrants from Panama Median Family Income
COMPARE
Jamaican
Immigrants from Panama
Median Family Income
Median Family Income Comparison
Jamaicans
Immigrants from Panama
$90,581
MEDIAN FAMILY INCOME
0.2/ 100
METRIC RATING
270th/ 347
METRIC RANK
$95,647
MEDIAN FAMILY INCOME
2.7/ 100
METRIC RATING
226th/ 347
METRIC RANK
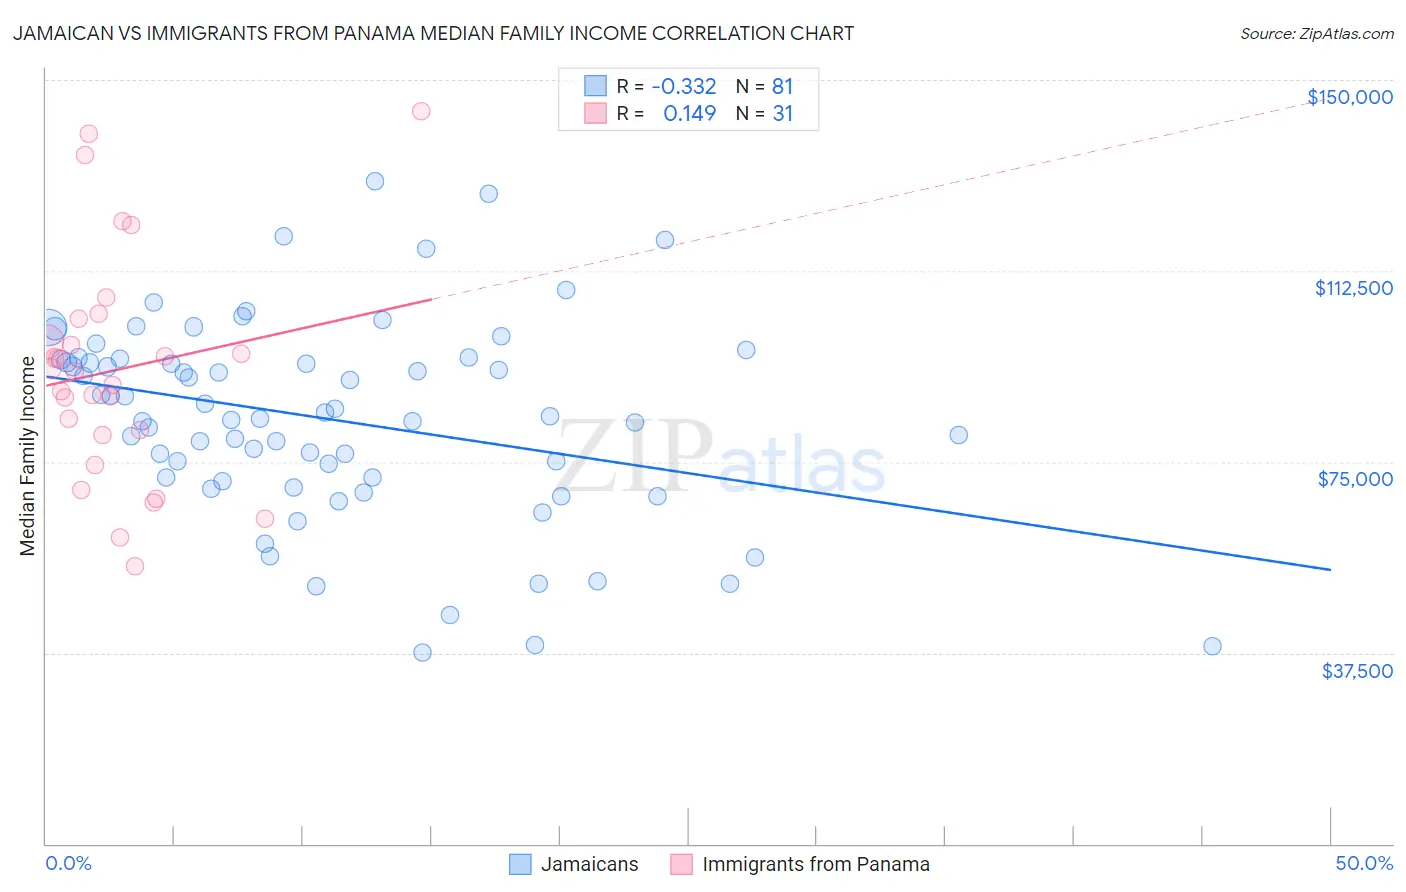
Jamaican vs Immigrants from Panama Median Family Income Correlation Chart
The statistical analysis conducted on geographies consisting of 367,485,053 people shows a mild negative correlation between the proportion of Jamaicans and median family income in the United States with a correlation coefficient (R) of -0.332 and weighted average of $90,581. Similarly, the statistical analysis conducted on geographies consisting of 221,145,724 people shows a poor positive correlation between the proportion of Immigrants from Panama and median family income in the United States with a correlation coefficient (R) of 0.149 and weighted average of $95,647, a difference of 5.6%.
Median Family Income Correlation Summary
| Measurement | Jamaican | Immigrants from Panama |
| Minimum | $37,461 | $54,583 |
| Maximum | $130,066 | $143,854 |
| Range | $92,605 | $89,271 |
| Mean | $83,374 | $93,119 |
| Median | $84,019 | $92,830 |
| Interquartile 25% (IQ1) | $71,528 | $80,245 |
| Interquartile 75% (IQ3) | $95,163 | $103,110 |
| Interquartile Range (IQR) | $23,635 | $22,865 |
| Standard Deviation (Sample) | $19,598 | $22,241 |
| Standard Deviation (Population) | $19,477 | $21,880 |
Similar Demographics by Median Family Income
Demographics Similar to Jamaicans by Median Family Income
In terms of median family income, the demographic groups most similar to Jamaicans are Iroquois ($90,543, a difference of 0.040%), Immigrants from Liberia ($90,450, a difference of 0.14%), Immigrants from Micronesia ($90,345, a difference of 0.26%), Spanish American ($90,322, a difference of 0.29%), and Cree ($90,882, a difference of 0.33%).
| Demographics | Rating | Rank | Median Family Income |
| Immigrants | West Indies | 0.3 /100 | #263 | Tragic $91,588 |
| Senegalese | 0.3 /100 | #264 | Tragic $91,475 |
| Hmong | 0.3 /100 | #265 | Tragic $91,296 |
| Central Americans | 0.3 /100 | #266 | Tragic $91,087 |
| Mexican American Indians | 0.2 /100 | #267 | Tragic $90,918 |
| Cree | 0.2 /100 | #268 | Tragic $90,882 |
| Belizeans | 0.2 /100 | #269 | Tragic $90,880 |
| Jamaicans | 0.2 /100 | #270 | Tragic $90,581 |
| Iroquois | 0.2 /100 | #271 | Tragic $90,543 |
| Immigrants | Liberia | 0.2 /100 | #272 | Tragic $90,450 |
| Immigrants | Micronesia | 0.2 /100 | #273 | Tragic $90,345 |
| Spanish Americans | 0.2 /100 | #274 | Tragic $90,322 |
| Immigrants | St. Vincent and the Grenadines | 0.2 /100 | #275 | Tragic $90,094 |
| Immigrants | Zaire | 0.1 /100 | #276 | Tragic $89,285 |
| Immigrants | Jamaica | 0.1 /100 | #277 | Tragic $89,268 |
Demographics Similar to Immigrants from Panama by Median Family Income
In terms of median family income, the demographic groups most similar to Immigrants from Panama are Alaska Native ($95,573, a difference of 0.080%), Immigrants from the Azores ($95,402, a difference of 0.26%), Marshallese ($95,293, a difference of 0.37%), Malaysian ($95,230, a difference of 0.44%), and Vietnamese ($96,123, a difference of 0.50%).
| Demographics | Rating | Rank | Median Family Income |
| Delaware | 5.1 /100 | #219 | Tragic $96,958 |
| Sudanese | 4.7 /100 | #220 | Tragic $96,783 |
| Immigrants | Ghana | 4.2 /100 | #221 | Tragic $96,544 |
| Immigrants | Nigeria | 4.0 /100 | #222 | Tragic $96,439 |
| Venezuelans | 3.7 /100 | #223 | Tragic $96,281 |
| Immigrants | Nonimmigrants | 3.6 /100 | #224 | Tragic $96,231 |
| Vietnamese | 3.4 /100 | #225 | Tragic $96,123 |
| Immigrants | Panama | 2.7 /100 | #226 | Tragic $95,647 |
| Alaska Natives | 2.6 /100 | #227 | Tragic $95,573 |
| Immigrants | Azores | 2.4 /100 | #228 | Tragic $95,402 |
| Marshallese | 2.2 /100 | #229 | Tragic $95,293 |
| Malaysians | 2.2 /100 | #230 | Tragic $95,230 |
| Ecuadorians | 2.1 /100 | #231 | Tragic $95,114 |
| Immigrants | Venezuela | 1.9 /100 | #232 | Tragic $94,904 |
| Immigrants | Bangladesh | 1.6 /100 | #233 | Tragic $94,665 |