Jamaican vs Samoan Median Family Income
COMPARE
Jamaican
Samoan
Median Family Income
Median Family Income Comparison
Jamaicans
Samoans
$90,581
MEDIAN FAMILY INCOME
0.2/ 100
METRIC RATING
270th/ 347
METRIC RANK
$100,344
MEDIAN FAMILY INCOME
23.3/ 100
METRIC RATING
196th/ 347
METRIC RANK
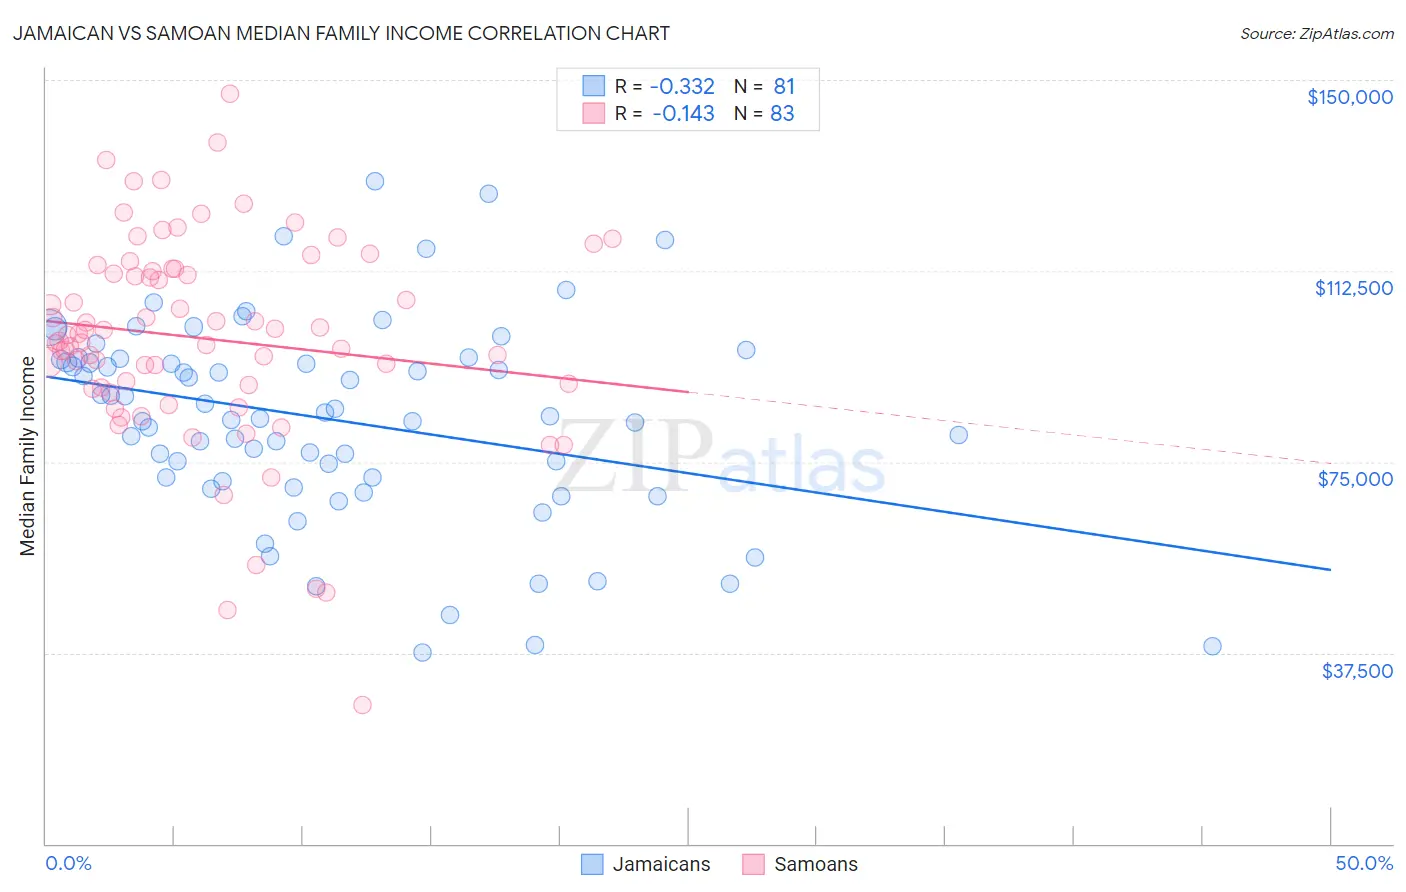
Jamaican vs Samoan Median Family Income Correlation Chart
The statistical analysis conducted on geographies consisting of 367,485,053 people shows a mild negative correlation between the proportion of Jamaicans and median family income in the United States with a correlation coefficient (R) of -0.332 and weighted average of $90,581. Similarly, the statistical analysis conducted on geographies consisting of 225,048,976 people shows a poor negative correlation between the proportion of Samoans and median family income in the United States with a correlation coefficient (R) of -0.143 and weighted average of $100,344, a difference of 10.8%.
Median Family Income Correlation Summary
| Measurement | Jamaican | Samoan |
| Minimum | $37,461 | $27,294 |
| Maximum | $130,066 | $147,200 |
| Range | $92,605 | $119,906 |
| Mean | $83,374 | $99,252 |
| Median | $84,019 | $99,920 |
| Interquartile 25% (IQ1) | $71,528 | $89,665 |
| Interquartile 75% (IQ3) | $95,163 | $112,813 |
| Interquartile Range (IQR) | $23,635 | $23,148 |
| Standard Deviation (Sample) | $19,598 | $20,629 |
| Standard Deviation (Population) | $19,477 | $20,504 |
Similar Demographics by Median Family Income
Demographics Similar to Jamaicans by Median Family Income
In terms of median family income, the demographic groups most similar to Jamaicans are Iroquois ($90,543, a difference of 0.040%), Immigrants from Liberia ($90,450, a difference of 0.14%), Immigrants from Micronesia ($90,345, a difference of 0.26%), Spanish American ($90,322, a difference of 0.29%), and Cree ($90,882, a difference of 0.33%).
| Demographics | Rating | Rank | Median Family Income |
| Immigrants | West Indies | 0.3 /100 | #263 | Tragic $91,588 |
| Senegalese | 0.3 /100 | #264 | Tragic $91,475 |
| Hmong | 0.3 /100 | #265 | Tragic $91,296 |
| Central Americans | 0.3 /100 | #266 | Tragic $91,087 |
| Mexican American Indians | 0.2 /100 | #267 | Tragic $90,918 |
| Cree | 0.2 /100 | #268 | Tragic $90,882 |
| Belizeans | 0.2 /100 | #269 | Tragic $90,880 |
| Jamaicans | 0.2 /100 | #270 | Tragic $90,581 |
| Iroquois | 0.2 /100 | #271 | Tragic $90,543 |
| Immigrants | Liberia | 0.2 /100 | #272 | Tragic $90,450 |
| Immigrants | Micronesia | 0.2 /100 | #273 | Tragic $90,345 |
| Spanish Americans | 0.2 /100 | #274 | Tragic $90,322 |
| Immigrants | St. Vincent and the Grenadines | 0.2 /100 | #275 | Tragic $90,094 |
| Immigrants | Zaire | 0.1 /100 | #276 | Tragic $89,285 |
| Immigrants | Jamaica | 0.1 /100 | #277 | Tragic $89,268 |
Demographics Similar to Samoans by Median Family Income
In terms of median family income, the demographic groups most similar to Samoans are Immigrants from Cameroon ($100,289, a difference of 0.060%), Immigrants from South America ($100,414, a difference of 0.070%), Immigrants from Africa ($100,256, a difference of 0.090%), Yugoslavian ($100,119, a difference of 0.22%), and Iraqi ($100,658, a difference of 0.31%).
| Demographics | Rating | Rank | Median Family Income |
| Immigrants | Portugal | 29.6 /100 | #189 | Fair $100,984 |
| Immigrants | Immigrants | 29.4 /100 | #190 | Fair $100,962 |
| Colombians | 27.2 /100 | #191 | Fair $100,750 |
| Immigrants | Kenya | 26.5 /100 | #192 | Fair $100,679 |
| Iraqis | 26.3 /100 | #193 | Fair $100,658 |
| Uruguayans | 26.3 /100 | #194 | Fair $100,656 |
| Immigrants | South America | 23.9 /100 | #195 | Fair $100,414 |
| Samoans | 23.3 /100 | #196 | Fair $100,344 |
| Immigrants | Cameroon | 22.8 /100 | #197 | Fair $100,289 |
| Immigrants | Africa | 22.5 /100 | #198 | Fair $100,256 |
| Yugoslavians | 21.3 /100 | #199 | Fair $100,119 |
| Spanish | 20.1 /100 | #200 | Fair $99,977 |
| Immigrants | Thailand | 19.0 /100 | #201 | Poor $99,840 |
| Whites/Caucasians | 18.7 /100 | #202 | Poor $99,800 |
| Scotch-Irish | 17.1 /100 | #203 | Poor $99,591 |