Jamaican vs Canadian Median Family Income
COMPARE
Jamaican
Canadian
Median Family Income
Median Family Income Comparison
Jamaicans
Canadians
$90,581
MEDIAN FAMILY INCOME
0.2/ 100
METRIC RATING
270th/ 347
METRIC RANK
$106,597
MEDIAN FAMILY INCOME
88.1/ 100
METRIC RATING
131st/ 347
METRIC RANK
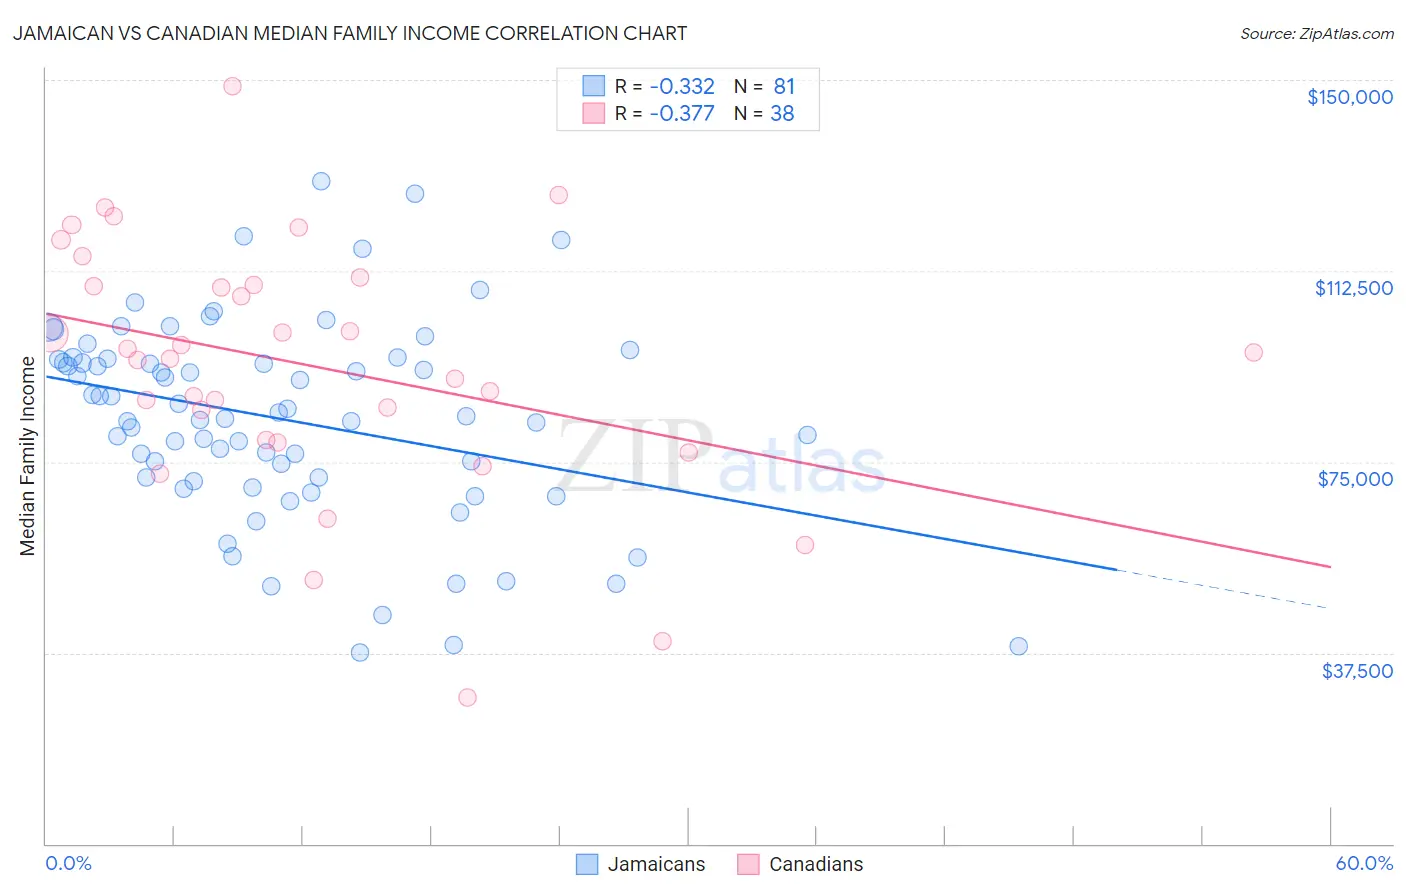
Jamaican vs Canadian Median Family Income Correlation Chart
The statistical analysis conducted on geographies consisting of 367,485,053 people shows a mild negative correlation between the proportion of Jamaicans and median family income in the United States with a correlation coefficient (R) of -0.332 and weighted average of $90,581. Similarly, the statistical analysis conducted on geographies consisting of 437,117,064 people shows a mild negative correlation between the proportion of Canadians and median family income in the United States with a correlation coefficient (R) of -0.377 and weighted average of $106,597, a difference of 17.7%.
Median Family Income Correlation Summary
| Measurement | Jamaican | Canadian |
| Minimum | $37,461 | $28,715 |
| Maximum | $130,066 | $148,748 |
| Range | $92,605 | $120,033 |
| Mean | $83,374 | $93,902 |
| Median | $84,019 | $95,805 |
| Interquartile 25% (IQ1) | $71,528 | $79,333 |
| Interquartile 75% (IQ3) | $95,163 | $109,797 |
| Interquartile Range (IQR) | $23,635 | $30,464 |
| Standard Deviation (Sample) | $19,598 | $24,866 |
| Standard Deviation (Population) | $19,477 | $24,537 |
Similar Demographics by Median Family Income
Demographics Similar to Jamaicans by Median Family Income
In terms of median family income, the demographic groups most similar to Jamaicans are Iroquois ($90,543, a difference of 0.040%), Immigrants from Liberia ($90,450, a difference of 0.14%), Immigrants from Micronesia ($90,345, a difference of 0.26%), Spanish American ($90,322, a difference of 0.29%), and Cree ($90,882, a difference of 0.33%).
| Demographics | Rating | Rank | Median Family Income |
| Immigrants | West Indies | 0.3 /100 | #263 | Tragic $91,588 |
| Senegalese | 0.3 /100 | #264 | Tragic $91,475 |
| Hmong | 0.3 /100 | #265 | Tragic $91,296 |
| Central Americans | 0.3 /100 | #266 | Tragic $91,087 |
| Mexican American Indians | 0.2 /100 | #267 | Tragic $90,918 |
| Cree | 0.2 /100 | #268 | Tragic $90,882 |
| Belizeans | 0.2 /100 | #269 | Tragic $90,880 |
| Jamaicans | 0.2 /100 | #270 | Tragic $90,581 |
| Iroquois | 0.2 /100 | #271 | Tragic $90,543 |
| Immigrants | Liberia | 0.2 /100 | #272 | Tragic $90,450 |
| Immigrants | Micronesia | 0.2 /100 | #273 | Tragic $90,345 |
| Spanish Americans | 0.2 /100 | #274 | Tragic $90,322 |
| Immigrants | St. Vincent and the Grenadines | 0.2 /100 | #275 | Tragic $90,094 |
| Immigrants | Zaire | 0.1 /100 | #276 | Tragic $89,285 |
| Immigrants | Jamaica | 0.1 /100 | #277 | Tragic $89,268 |
Demographics Similar to Canadians by Median Family Income
In terms of median family income, the demographic groups most similar to Canadians are Immigrants from Fiji ($106,544, a difference of 0.050%), Ugandan ($106,541, a difference of 0.050%), Immigrants from Oceania ($106,453, a difference of 0.14%), Portuguese ($106,286, a difference of 0.29%), and Brazilian ($106,942, a difference of 0.32%).
| Demographics | Rating | Rank | Median Family Income |
| Pakistanis | 91.7 /100 | #124 | Exceptional $107,390 |
| Taiwanese | 91.4 /100 | #125 | Exceptional $107,295 |
| Serbians | 90.8 /100 | #126 | Exceptional $107,157 |
| Lebanese | 90.5 /100 | #127 | Exceptional $107,086 |
| Immigrants | Ethiopia | 90.0 /100 | #128 | Excellent $106,969 |
| Arabs | 89.9 /100 | #129 | Excellent $106,952 |
| Brazilians | 89.8 /100 | #130 | Excellent $106,942 |
| Canadians | 88.1 /100 | #131 | Excellent $106,597 |
| Immigrants | Fiji | 87.8 /100 | #132 | Excellent $106,544 |
| Ugandans | 87.8 /100 | #133 | Excellent $106,541 |
| Immigrants | Oceania | 87.3 /100 | #134 | Excellent $106,453 |
| Portuguese | 86.3 /100 | #135 | Excellent $106,286 |
| Immigrants | South Eastern Asia | 86.1 /100 | #136 | Excellent $106,252 |
| Immigrants | Uganda | 85.7 /100 | #137 | Excellent $106,188 |
| Immigrants | Vietnam | 85.7 /100 | #138 | Excellent $106,186 |