Sri Lankan vs Immigrants from Panama Median Family Income
COMPARE
Sri Lankan
Immigrants from Panama
Median Family Income
Median Family Income Comparison
Sri Lankans
Immigrants from Panama
$108,234
MEDIAN FAMILY INCOME
94.5/ 100
METRIC RATING
119th/ 347
METRIC RANK
$95,647
MEDIAN FAMILY INCOME
2.7/ 100
METRIC RATING
226th/ 347
METRIC RANK
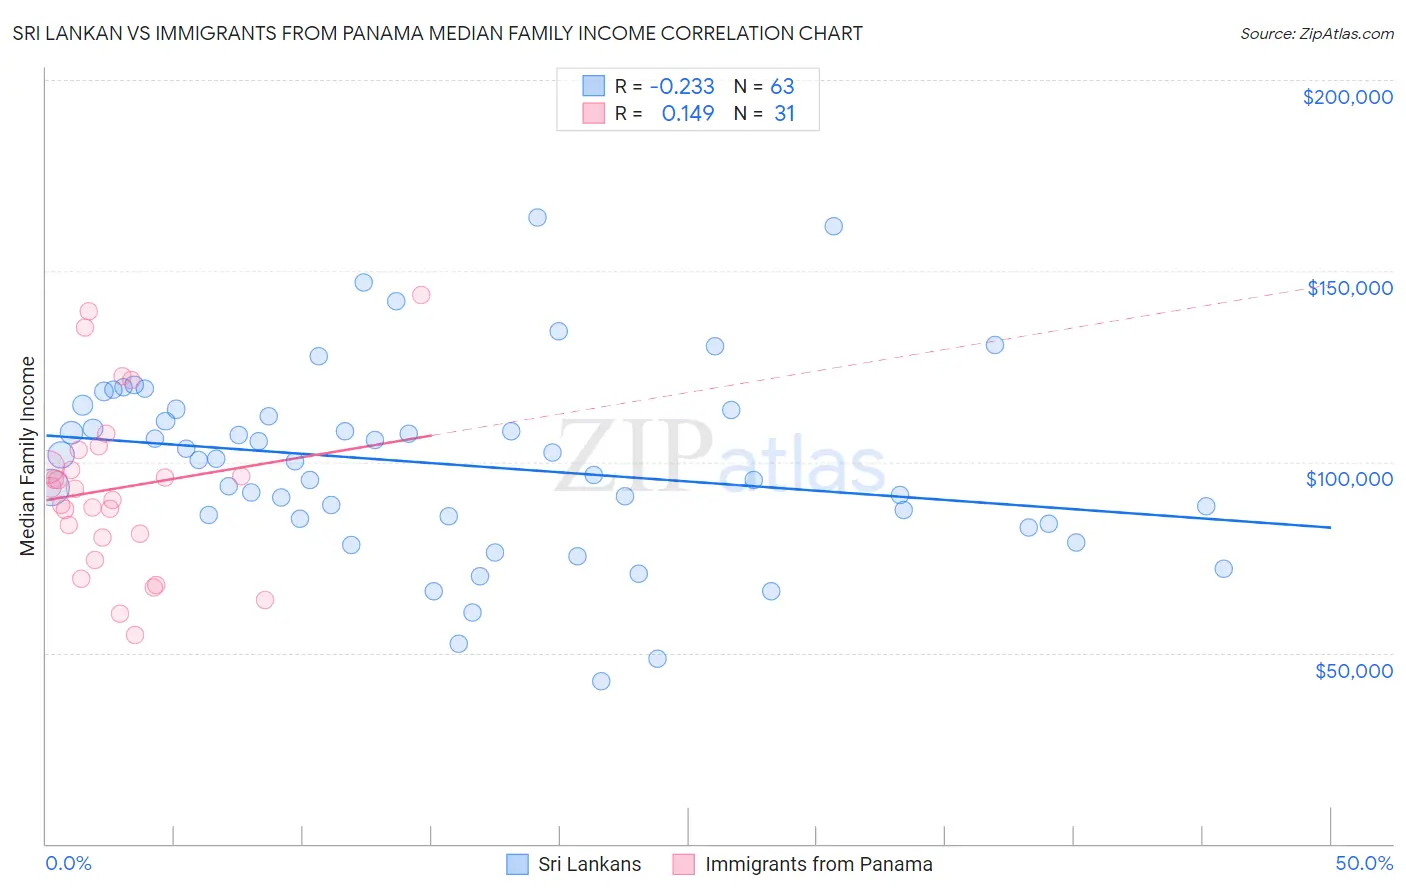
Sri Lankan vs Immigrants from Panama Median Family Income Correlation Chart
The statistical analysis conducted on geographies consisting of 439,902,823 people shows a weak negative correlation between the proportion of Sri Lankans and median family income in the United States with a correlation coefficient (R) of -0.233 and weighted average of $108,234. Similarly, the statistical analysis conducted on geographies consisting of 221,145,724 people shows a poor positive correlation between the proportion of Immigrants from Panama and median family income in the United States with a correlation coefficient (R) of 0.149 and weighted average of $95,647, a difference of 13.2%.
Median Family Income Correlation Summary
| Measurement | Sri Lankan | Immigrants from Panama |
| Minimum | $42,404 | $54,583 |
| Maximum | $164,143 | $143,854 |
| Range | $121,739 | $89,271 |
| Mean | $99,316 | $93,119 |
| Median | $100,475 | $92,830 |
| Interquartile 25% (IQ1) | $84,952 | $80,245 |
| Interquartile 75% (IQ3) | $113,711 | $103,110 |
| Interquartile Range (IQR) | $28,760 | $22,865 |
| Standard Deviation (Sample) | $24,633 | $22,241 |
| Standard Deviation (Population) | $24,437 | $21,880 |
Similar Demographics by Median Family Income
Demographics Similar to Sri Lankans by Median Family Income
In terms of median family income, the demographic groups most similar to Sri Lankans are Ethiopian ($108,251, a difference of 0.020%), Immigrants from Philippines ($108,288, a difference of 0.050%), Immigrants from Northern Africa ($108,161, a difference of 0.070%), European ($108,099, a difference of 0.12%), and Chilean ($108,429, a difference of 0.18%).
| Demographics | Rating | Rank | Median Family Income |
| Immigrants | Poland | 95.3 /100 | #112 | Exceptional $108,570 |
| Immigrants | Saudi Arabia | 95.2 /100 | #113 | Exceptional $108,544 |
| Poles | 95.2 /100 | #114 | Exceptional $108,507 |
| Swedes | 95.1 /100 | #115 | Exceptional $108,499 |
| Chileans | 95.0 /100 | #116 | Exceptional $108,429 |
| Immigrants | Philippines | 94.6 /100 | #117 | Exceptional $108,288 |
| Ethiopians | 94.5 /100 | #118 | Exceptional $108,251 |
| Sri Lankans | 94.5 /100 | #119 | Exceptional $108,234 |
| Immigrants | Northern Africa | 94.3 /100 | #120 | Exceptional $108,161 |
| Europeans | 94.1 /100 | #121 | Exceptional $108,099 |
| Immigrants | Jordan | 92.9 /100 | #122 | Exceptional $107,715 |
| Carpatho Rusyns | 92.2 /100 | #123 | Exceptional $107,502 |
| Pakistanis | 91.7 /100 | #124 | Exceptional $107,390 |
| Taiwanese | 91.4 /100 | #125 | Exceptional $107,295 |
| Serbians | 90.8 /100 | #126 | Exceptional $107,157 |
Demographics Similar to Immigrants from Panama by Median Family Income
In terms of median family income, the demographic groups most similar to Immigrants from Panama are Alaska Native ($95,573, a difference of 0.080%), Immigrants from the Azores ($95,402, a difference of 0.26%), Marshallese ($95,293, a difference of 0.37%), Malaysian ($95,230, a difference of 0.44%), and Vietnamese ($96,123, a difference of 0.50%).
| Demographics | Rating | Rank | Median Family Income |
| Delaware | 5.1 /100 | #219 | Tragic $96,958 |
| Sudanese | 4.7 /100 | #220 | Tragic $96,783 |
| Immigrants | Ghana | 4.2 /100 | #221 | Tragic $96,544 |
| Immigrants | Nigeria | 4.0 /100 | #222 | Tragic $96,439 |
| Venezuelans | 3.7 /100 | #223 | Tragic $96,281 |
| Immigrants | Nonimmigrants | 3.6 /100 | #224 | Tragic $96,231 |
| Vietnamese | 3.4 /100 | #225 | Tragic $96,123 |
| Immigrants | Panama | 2.7 /100 | #226 | Tragic $95,647 |
| Alaska Natives | 2.6 /100 | #227 | Tragic $95,573 |
| Immigrants | Azores | 2.4 /100 | #228 | Tragic $95,402 |
| Marshallese | 2.2 /100 | #229 | Tragic $95,293 |
| Malaysians | 2.2 /100 | #230 | Tragic $95,230 |
| Ecuadorians | 2.1 /100 | #231 | Tragic $95,114 |
| Immigrants | Venezuela | 1.9 /100 | #232 | Tragic $94,904 |
| Immigrants | Bangladesh | 1.6 /100 | #233 | Tragic $94,665 |