Jamaican vs Haitian Median Family Income
COMPARE
Jamaican
Haitian
Median Family Income
Median Family Income Comparison
Jamaicans
Haitians
$90,581
MEDIAN FAMILY INCOME
0.2/ 100
METRIC RATING
270th/ 347
METRIC RANK
$85,218
MEDIAN FAMILY INCOME
0.0/ 100
METRIC RATING
309th/ 347
METRIC RANK
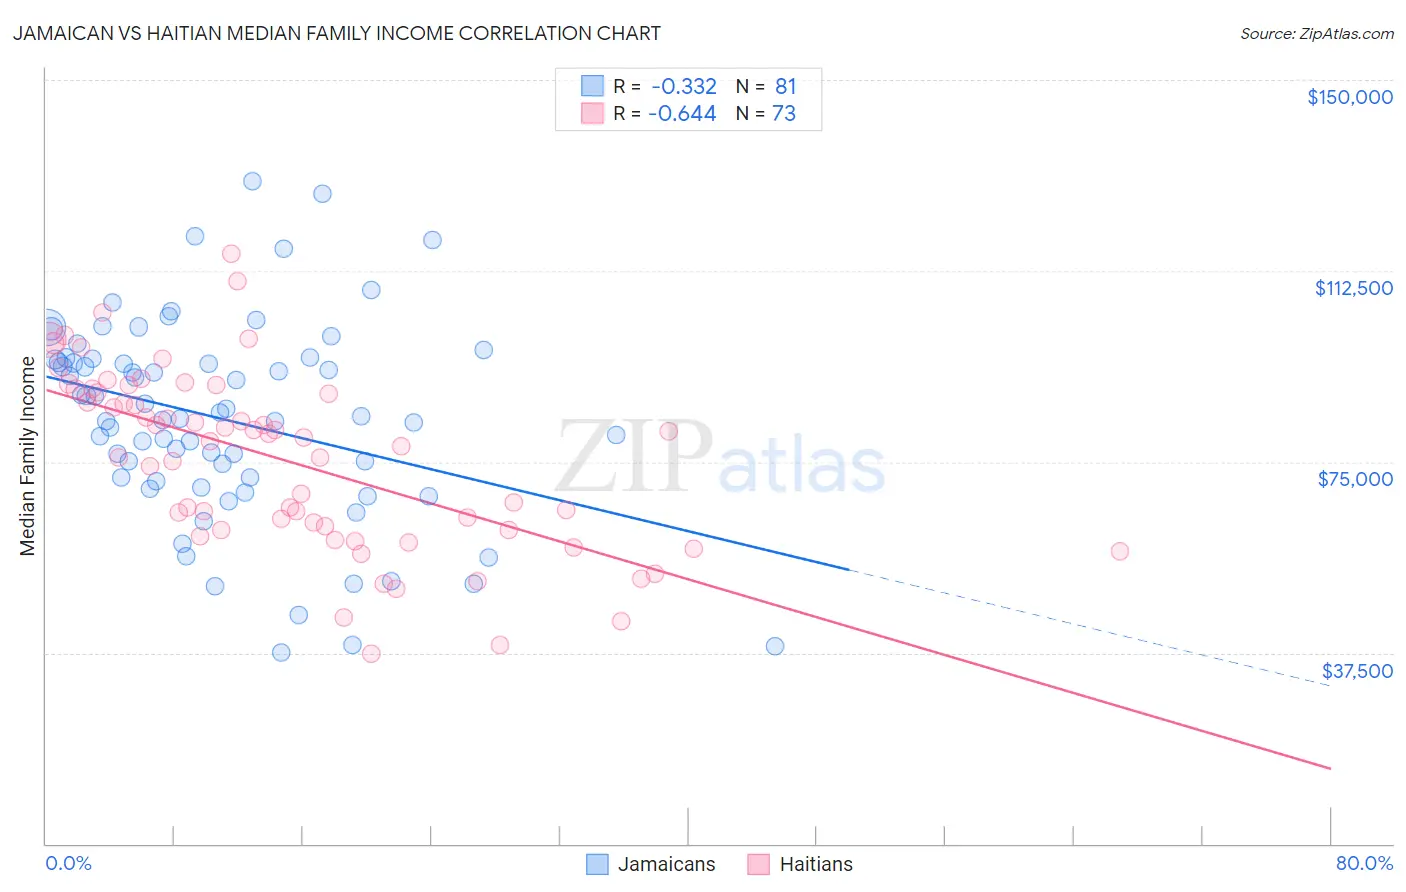
Jamaican vs Haitian Median Family Income Correlation Chart
The statistical analysis conducted on geographies consisting of 367,485,053 people shows a mild negative correlation between the proportion of Jamaicans and median family income in the United States with a correlation coefficient (R) of -0.332 and weighted average of $90,581. Similarly, the statistical analysis conducted on geographies consisting of 287,578,429 people shows a significant negative correlation between the proportion of Haitians and median family income in the United States with a correlation coefficient (R) of -0.644 and weighted average of $85,218, a difference of 6.3%.
Median Family Income Correlation Summary
| Measurement | Jamaican | Haitian |
| Minimum | $37,461 | $37,244 |
| Maximum | $130,066 | $115,792 |
| Range | $92,605 | $78,548 |
| Mean | $83,374 | $75,276 |
| Median | $84,019 | $79,021 |
| Interquartile 25% (IQ1) | $71,528 | $61,587 |
| Interquartile 75% (IQ3) | $95,163 | $88,995 |
| Interquartile Range (IQR) | $23,635 | $27,408 |
| Standard Deviation (Sample) | $19,598 | $17,405 |
| Standard Deviation (Population) | $19,477 | $17,285 |
Similar Demographics by Median Family Income
Demographics Similar to Jamaicans by Median Family Income
In terms of median family income, the demographic groups most similar to Jamaicans are Iroquois ($90,543, a difference of 0.040%), Immigrants from Liberia ($90,450, a difference of 0.14%), Immigrants from Micronesia ($90,345, a difference of 0.26%), Spanish American ($90,322, a difference of 0.29%), and Cree ($90,882, a difference of 0.33%).
| Demographics | Rating | Rank | Median Family Income |
| Immigrants | West Indies | 0.3 /100 | #263 | Tragic $91,588 |
| Senegalese | 0.3 /100 | #264 | Tragic $91,475 |
| Hmong | 0.3 /100 | #265 | Tragic $91,296 |
| Central Americans | 0.3 /100 | #266 | Tragic $91,087 |
| Mexican American Indians | 0.2 /100 | #267 | Tragic $90,918 |
| Cree | 0.2 /100 | #268 | Tragic $90,882 |
| Belizeans | 0.2 /100 | #269 | Tragic $90,880 |
| Jamaicans | 0.2 /100 | #270 | Tragic $90,581 |
| Iroquois | 0.2 /100 | #271 | Tragic $90,543 |
| Immigrants | Liberia | 0.2 /100 | #272 | Tragic $90,450 |
| Immigrants | Micronesia | 0.2 /100 | #273 | Tragic $90,345 |
| Spanish Americans | 0.2 /100 | #274 | Tragic $90,322 |
| Immigrants | St. Vincent and the Grenadines | 0.2 /100 | #275 | Tragic $90,094 |
| Immigrants | Zaire | 0.1 /100 | #276 | Tragic $89,285 |
| Immigrants | Jamaica | 0.1 /100 | #277 | Tragic $89,268 |
Demographics Similar to Haitians by Median Family Income
In terms of median family income, the demographic groups most similar to Haitians are U.S. Virgin Islander ($85,294, a difference of 0.090%), Chickasaw ($85,356, a difference of 0.16%), Immigrants from Central America ($85,050, a difference of 0.20%), Paiute ($85,414, a difference of 0.23%), and Immigrants from Dominica ($85,411, a difference of 0.23%).
| Demographics | Rating | Rank | Median Family Income |
| Spanish American Indians | 0.0 /100 | #302 | Tragic $85,728 |
| Hispanics or Latinos | 0.0 /100 | #303 | Tragic $85,647 |
| Mexicans | 0.0 /100 | #304 | Tragic $85,618 |
| Paiute | 0.0 /100 | #305 | Tragic $85,414 |
| Immigrants | Dominica | 0.0 /100 | #306 | Tragic $85,411 |
| Chickasaw | 0.0 /100 | #307 | Tragic $85,356 |
| U.S. Virgin Islanders | 0.0 /100 | #308 | Tragic $85,294 |
| Haitians | 0.0 /100 | #309 | Tragic $85,218 |
| Immigrants | Central America | 0.0 /100 | #310 | Tragic $85,050 |
| Hondurans | 0.0 /100 | #311 | Tragic $85,004 |
| Cubans | 0.0 /100 | #312 | Tragic $84,981 |
| Choctaw | 0.0 /100 | #313 | Tragic $84,835 |
| Immigrants | Bahamas | 0.0 /100 | #314 | Tragic $84,732 |
| Apache | 0.0 /100 | #315 | Tragic $84,451 |
| Immigrants | Haiti | 0.0 /100 | #316 | Tragic $84,018 |