Jamaican vs Immigrants from Panama Unemployment Among Ages 25 to 29 years
COMPARE
Jamaican
Immigrants from Panama
Unemployment Among Ages 25 to 29 years
Unemployment Among Ages 25 to 29 years Comparison
Jamaicans
Immigrants from Panama
7.9%
UNEMPLOYMENT AMONG AGES 25 TO 29 YEARS
0.0/ 100
METRIC RATING
302nd/ 347
METRIC RANK
7.0%
UNEMPLOYMENT AMONG AGES 25 TO 29 YEARS
4.2/ 100
METRIC RATING
228th/ 347
METRIC RANK
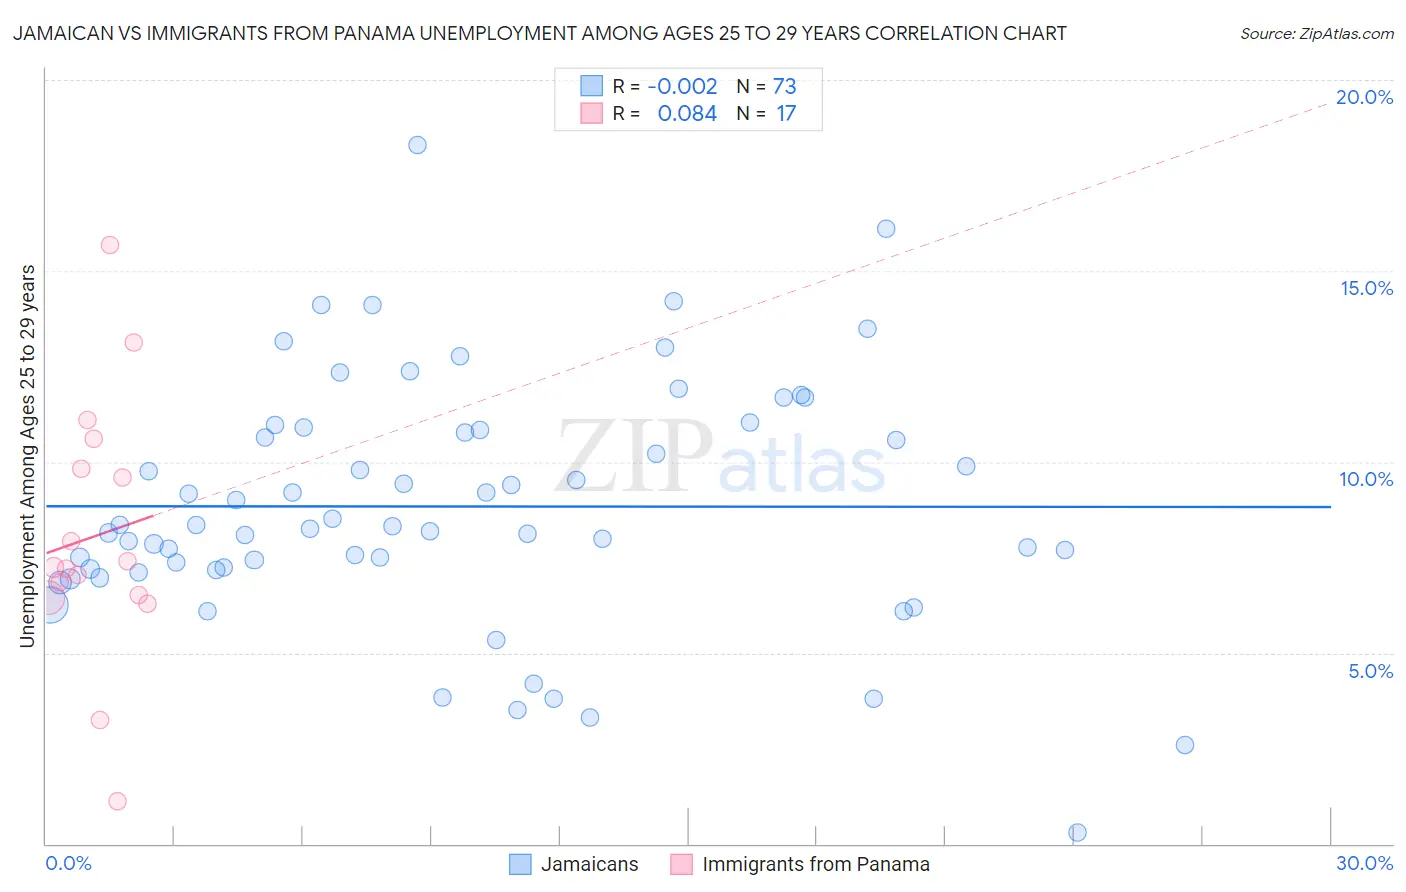
Jamaican vs Immigrants from Panama Unemployment Among Ages 25 to 29 years Correlation Chart
The statistical analysis conducted on geographies consisting of 352,650,790 people shows no correlation between the proportion of Jamaicans and unemployment rate among population between the ages 25 and 29 in the United States with a correlation coefficient (R) of -0.002 and weighted average of 7.9%. Similarly, the statistical analysis conducted on geographies consisting of 215,911,091 people shows a slight positive correlation between the proportion of Immigrants from Panama and unemployment rate among population between the ages 25 and 29 in the United States with a correlation coefficient (R) of 0.084 and weighted average of 7.0%, a difference of 13.6%.
Unemployment Among Ages 25 to 29 years Correlation Summary
| Measurement | Jamaican | Immigrants from Panama |
| Minimum | 0.30% | 1.1% |
| Maximum | 18.3% | 15.7% |
| Range | 18.0% | 14.6% |
| Mean | 8.8% | 8.1% |
| Median | 8.3% | 7.2% |
| Interquartile 25% (IQ1) | 7.2% | 6.5% |
| Interquartile 75% (IQ3) | 10.9% | 10.2% |
| Interquartile Range (IQR) | 3.7% | 3.7% |
| Standard Deviation (Sample) | 3.2% | 3.4% |
| Standard Deviation (Population) | 3.2% | 3.3% |
Similar Demographics by Unemployment Among Ages 25 to 29 years
Demographics Similar to Jamaicans by Unemployment Among Ages 25 to 29 years
In terms of unemployment among ages 25 to 29 years, the demographic groups most similar to Jamaicans are West Indian (7.9%, a difference of 0.16%), Central American Indian (7.9%, a difference of 0.18%), Barbadian (7.9%, a difference of 0.20%), Immigrants from Trinidad and Tobago (7.9%, a difference of 0.38%), and Blackfeet (7.9%, a difference of 0.64%).
| Demographics | Rating | Rank | Unemployment Among Ages 25 to 29 years |
| Comanche | 0.0 /100 | #295 | Tragic 7.8% |
| Immigrants | West Indies | 0.0 /100 | #296 | Tragic 7.8% |
| Blackfeet | 0.0 /100 | #297 | Tragic 7.9% |
| Immigrants | Trinidad and Tobago | 0.0 /100 | #298 | Tragic 7.9% |
| Barbadians | 0.0 /100 | #299 | Tragic 7.9% |
| Central American Indians | 0.0 /100 | #300 | Tragic 7.9% |
| West Indians | 0.0 /100 | #301 | Tragic 7.9% |
| Jamaicans | 0.0 /100 | #302 | Tragic 7.9% |
| Immigrants | Yemen | 0.0 /100 | #303 | Tragic 8.0% |
| Cajuns | 0.0 /100 | #304 | Tragic 8.0% |
| Tsimshian | 0.0 /100 | #305 | Tragic 8.0% |
| Haitians | 0.0 /100 | #306 | Tragic 8.0% |
| Immigrants | Barbados | 0.0 /100 | #307 | Tragic 8.0% |
| Immigrants | Jamaica | 0.0 /100 | #308 | Tragic 8.1% |
| Immigrants | Haiti | 0.0 /100 | #309 | Tragic 8.1% |
Demographics Similar to Immigrants from Panama by Unemployment Among Ages 25 to 29 years
In terms of unemployment among ages 25 to 29 years, the demographic groups most similar to Immigrants from Panama are Salvadoran (7.0%, a difference of 0.050%), Bermudan (7.0%, a difference of 0.15%), Immigrants from Liberia (7.0%, a difference of 0.18%), Immigrants from El Salvador (7.0%, a difference of 0.23%), and Japanese (6.9%, a difference of 0.38%).
| Demographics | Rating | Rank | Unemployment Among Ages 25 to 29 years |
| Israelis | 9.8 /100 | #221 | Tragic 6.9% |
| Spaniards | 7.7 /100 | #222 | Tragic 6.9% |
| Celtics | 7.6 /100 | #223 | Tragic 6.9% |
| Immigrants | Immigrants | 6.2 /100 | #224 | Tragic 6.9% |
| Japanese | 5.4 /100 | #225 | Tragic 6.9% |
| Immigrants | Liberia | 4.8 /100 | #226 | Tragic 7.0% |
| Salvadorans | 4.4 /100 | #227 | Tragic 7.0% |
| Immigrants | Panama | 4.2 /100 | #228 | Tragic 7.0% |
| Bermudans | 3.8 /100 | #229 | Tragic 7.0% |
| Immigrants | El Salvador | 3.6 /100 | #230 | Tragic 7.0% |
| Central Americans | 3.0 /100 | #231 | Tragic 7.0% |
| Spanish Americans | 2.7 /100 | #232 | Tragic 7.0% |
| Immigrants | Honduras | 2.4 /100 | #233 | Tragic 7.0% |
| French Canadians | 2.4 /100 | #234 | Tragic 7.0% |
| Panamanians | 2.1 /100 | #235 | Tragic 7.0% |