Jamaican vs West Indian Median Family Income
COMPARE
Jamaican
West Indian
Median Family Income
Median Family Income Comparison
Jamaicans
West Indians
$90,581
MEDIAN FAMILY INCOME
0.2/ 100
METRIC RATING
270th/ 347
METRIC RANK
$92,765
MEDIAN FAMILY INCOME
0.6/ 100
METRIC RATING
250th/ 347
METRIC RANK
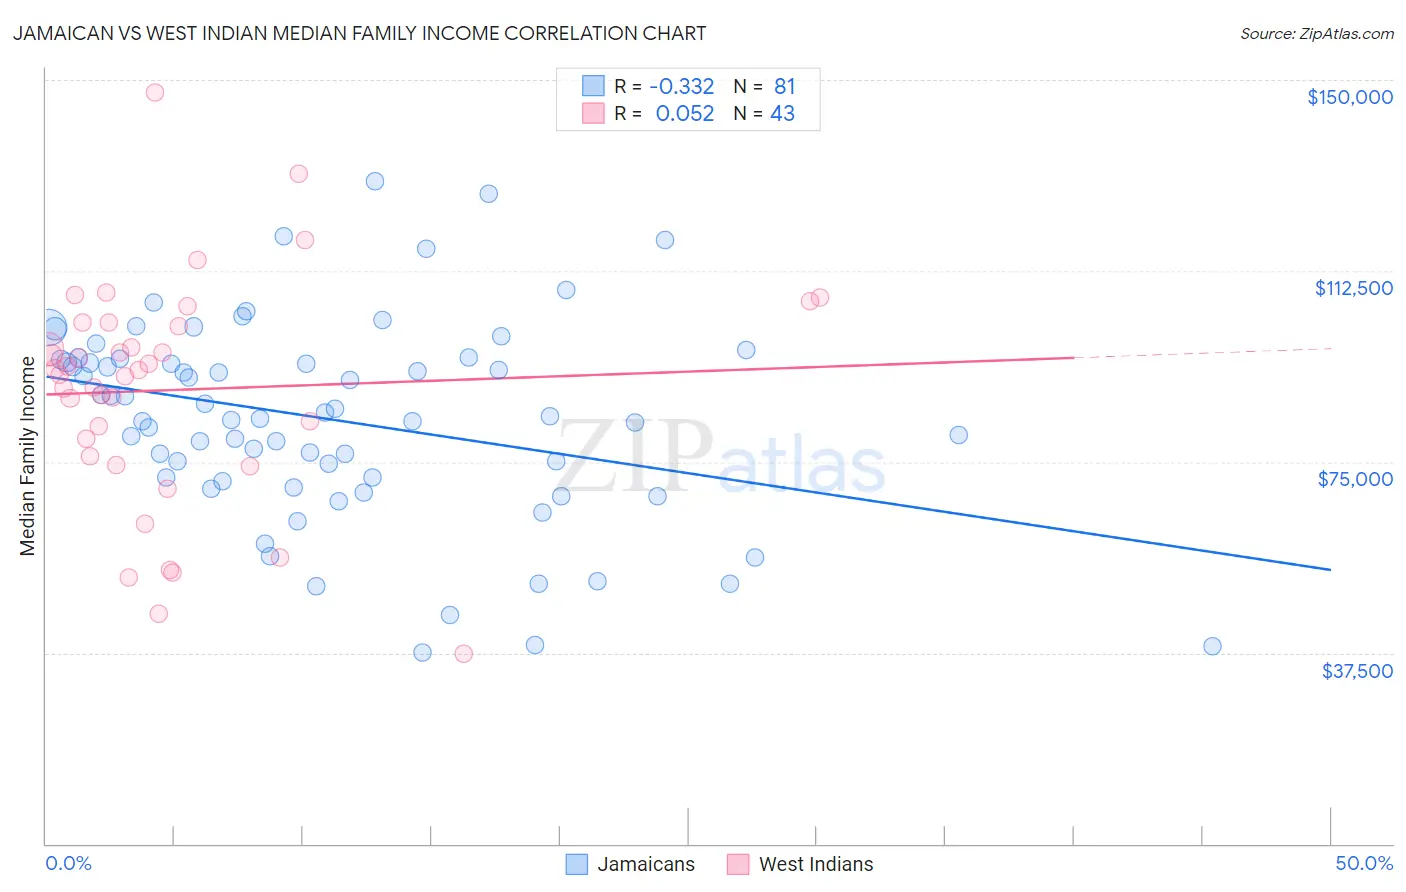
Jamaican vs West Indian Median Family Income Correlation Chart
The statistical analysis conducted on geographies consisting of 367,485,053 people shows a mild negative correlation between the proportion of Jamaicans and median family income in the United States with a correlation coefficient (R) of -0.332 and weighted average of $90,581. Similarly, the statistical analysis conducted on geographies consisting of 253,786,025 people shows a slight positive correlation between the proportion of West Indians and median family income in the United States with a correlation coefficient (R) of 0.052 and weighted average of $92,765, a difference of 2.4%.
Median Family Income Correlation Summary
| Measurement | Jamaican | West Indian |
| Minimum | $37,461 | $37,244 |
| Maximum | $130,066 | $147,600 |
| Range | $92,605 | $110,356 |
| Mean | $83,374 | $89,153 |
| Median | $84,019 | $92,948 |
| Interquartile 25% (IQ1) | $71,528 | $76,053 |
| Interquartile 75% (IQ3) | $95,163 | $102,268 |
| Interquartile Range (IQR) | $23,635 | $26,215 |
| Standard Deviation (Sample) | $19,598 | $22,238 |
| Standard Deviation (Population) | $19,477 | $21,978 |
Demographics Similar to Jamaicans and West Indians by Median Family Income
In terms of median family income, the demographic groups most similar to Jamaicans are Cree ($90,882, a difference of 0.33%), Belizean ($90,880, a difference of 0.33%), Mexican American Indian ($90,918, a difference of 0.37%), Central American ($91,087, a difference of 0.56%), and Hmong ($91,296, a difference of 0.79%). Similarly, the demographic groups most similar to West Indians are Immigrants from Somalia ($92,609, a difference of 0.17%), Immigrants from El Salvador ($92,545, a difference of 0.24%), Immigrants from Guyana ($92,513, a difference of 0.27%), Immigrants from Barbados ($92,419, a difference of 0.37%), and Immigrants from Laos ($92,239, a difference of 0.57%).
| Demographics | Rating | Rank | Median Family Income |
| West Indians | 0.6 /100 | #250 | Tragic $92,765 |
| Immigrants | Somalia | 0.6 /100 | #251 | Tragic $92,609 |
| Immigrants | El Salvador | 0.6 /100 | #252 | Tragic $92,545 |
| Immigrants | Guyana | 0.6 /100 | #253 | Tragic $92,513 |
| Immigrants | Barbados | 0.5 /100 | #254 | Tragic $92,419 |
| Immigrants | Laos | 0.5 /100 | #255 | Tragic $92,239 |
| Nicaraguans | 0.5 /100 | #256 | Tragic $92,231 |
| Americans | 0.4 /100 | #257 | Tragic $92,096 |
| Osage | 0.4 /100 | #258 | Tragic $91,926 |
| Cape Verdeans | 0.4 /100 | #259 | Tragic $91,848 |
| Pennsylvania Germans | 0.4 /100 | #260 | Tragic $91,763 |
| Inupiat | 0.4 /100 | #261 | Tragic $91,730 |
| Liberians | 0.4 /100 | #262 | Tragic $91,722 |
| Immigrants | West Indies | 0.3 /100 | #263 | Tragic $91,588 |
| Senegalese | 0.3 /100 | #264 | Tragic $91,475 |
| Hmong | 0.3 /100 | #265 | Tragic $91,296 |
| Central Americans | 0.3 /100 | #266 | Tragic $91,087 |
| Mexican American Indians | 0.2 /100 | #267 | Tragic $90,918 |
| Cree | 0.2 /100 | #268 | Tragic $90,882 |
| Belizeans | 0.2 /100 | #269 | Tragic $90,880 |
| Jamaicans | 0.2 /100 | #270 | Tragic $90,581 |