Ethiopian vs Immigrants from Panama Median Family Income
COMPARE
Ethiopian
Immigrants from Panama
Median Family Income
Median Family Income Comparison
Ethiopians
Immigrants from Panama
$108,251
MEDIAN FAMILY INCOME
94.5/ 100
METRIC RATING
118th/ 347
METRIC RANK
$95,647
MEDIAN FAMILY INCOME
2.7/ 100
METRIC RATING
226th/ 347
METRIC RANK
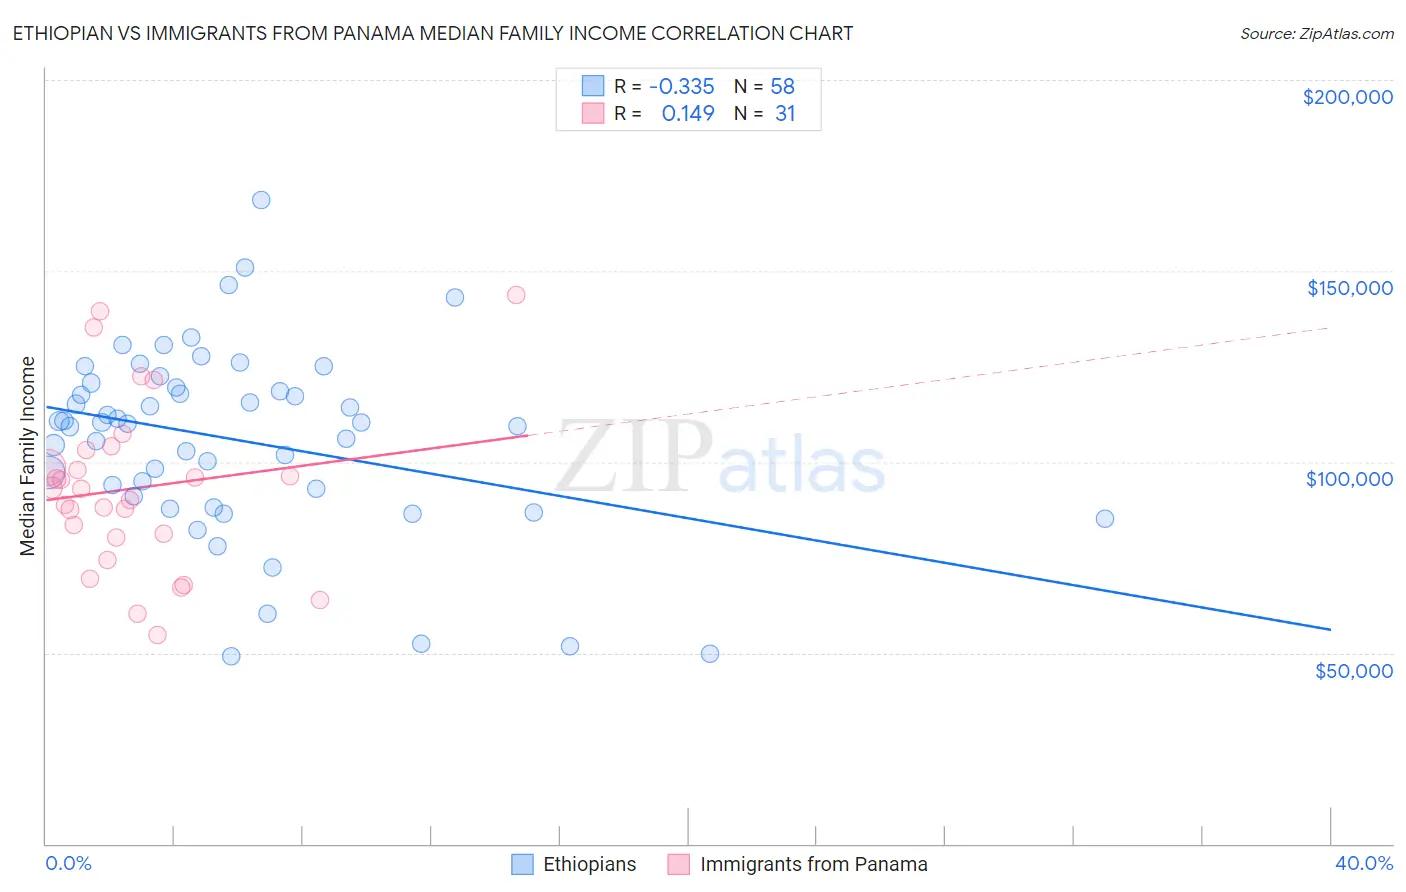
Ethiopian vs Immigrants from Panama Median Family Income Correlation Chart
The statistical analysis conducted on geographies consisting of 223,032,575 people shows a mild negative correlation between the proportion of Ethiopians and median family income in the United States with a correlation coefficient (R) of -0.335 and weighted average of $108,251. Similarly, the statistical analysis conducted on geographies consisting of 221,145,724 people shows a poor positive correlation between the proportion of Immigrants from Panama and median family income in the United States with a correlation coefficient (R) of 0.149 and weighted average of $95,647, a difference of 13.2%.
Median Family Income Correlation Summary
| Measurement | Ethiopian | Immigrants from Panama |
| Minimum | $48,964 | $54,583 |
| Maximum | $168,594 | $143,854 |
| Range | $119,630 | $89,271 |
| Mean | $105,611 | $93,119 |
| Median | $110,185 | $92,830 |
| Interquartile 25% (IQ1) | $91,124 | $80,245 |
| Interquartile 75% (IQ3) | $119,625 | $103,110 |
| Interquartile Range (IQR) | $28,501 | $22,865 |
| Standard Deviation (Sample) | $24,590 | $22,241 |
| Standard Deviation (Population) | $24,377 | $21,880 |
Similar Demographics by Median Family Income
Demographics Similar to Ethiopians by Median Family Income
In terms of median family income, the demographic groups most similar to Ethiopians are Sri Lankan ($108,234, a difference of 0.020%), Immigrants from Philippines ($108,288, a difference of 0.030%), Immigrants from Northern Africa ($108,161, a difference of 0.080%), European ($108,099, a difference of 0.14%), and Chilean ($108,429, a difference of 0.16%).
| Demographics | Rating | Rank | Median Family Income |
| Immigrants | Western Asia | 95.6 /100 | #111 | Exceptional $108,691 |
| Immigrants | Poland | 95.3 /100 | #112 | Exceptional $108,570 |
| Immigrants | Saudi Arabia | 95.2 /100 | #113 | Exceptional $108,544 |
| Poles | 95.2 /100 | #114 | Exceptional $108,507 |
| Swedes | 95.1 /100 | #115 | Exceptional $108,499 |
| Chileans | 95.0 /100 | #116 | Exceptional $108,429 |
| Immigrants | Philippines | 94.6 /100 | #117 | Exceptional $108,288 |
| Ethiopians | 94.5 /100 | #118 | Exceptional $108,251 |
| Sri Lankans | 94.5 /100 | #119 | Exceptional $108,234 |
| Immigrants | Northern Africa | 94.3 /100 | #120 | Exceptional $108,161 |
| Europeans | 94.1 /100 | #121 | Exceptional $108,099 |
| Immigrants | Jordan | 92.9 /100 | #122 | Exceptional $107,715 |
| Carpatho Rusyns | 92.2 /100 | #123 | Exceptional $107,502 |
| Pakistanis | 91.7 /100 | #124 | Exceptional $107,390 |
| Taiwanese | 91.4 /100 | #125 | Exceptional $107,295 |
Demographics Similar to Immigrants from Panama by Median Family Income
In terms of median family income, the demographic groups most similar to Immigrants from Panama are Alaska Native ($95,573, a difference of 0.080%), Immigrants from the Azores ($95,402, a difference of 0.26%), Marshallese ($95,293, a difference of 0.37%), Malaysian ($95,230, a difference of 0.44%), and Vietnamese ($96,123, a difference of 0.50%).
| Demographics | Rating | Rank | Median Family Income |
| Delaware | 5.1 /100 | #219 | Tragic $96,958 |
| Sudanese | 4.7 /100 | #220 | Tragic $96,783 |
| Immigrants | Ghana | 4.2 /100 | #221 | Tragic $96,544 |
| Immigrants | Nigeria | 4.0 /100 | #222 | Tragic $96,439 |
| Venezuelans | 3.7 /100 | #223 | Tragic $96,281 |
| Immigrants | Nonimmigrants | 3.6 /100 | #224 | Tragic $96,231 |
| Vietnamese | 3.4 /100 | #225 | Tragic $96,123 |
| Immigrants | Panama | 2.7 /100 | #226 | Tragic $95,647 |
| Alaska Natives | 2.6 /100 | #227 | Tragic $95,573 |
| Immigrants | Azores | 2.4 /100 | #228 | Tragic $95,402 |
| Marshallese | 2.2 /100 | #229 | Tragic $95,293 |
| Malaysians | 2.2 /100 | #230 | Tragic $95,230 |
| Ecuadorians | 2.1 /100 | #231 | Tragic $95,114 |
| Immigrants | Venezuela | 1.9 /100 | #232 | Tragic $94,904 |
| Immigrants | Bangladesh | 1.6 /100 | #233 | Tragic $94,665 |