Jamaican vs French American Indian Median Family Income
COMPARE
Jamaican
French American Indian
Median Family Income
Median Family Income Comparison
Jamaicans
French American Indians
$90,581
MEDIAN FAMILY INCOME
0.2/ 100
METRIC RATING
270th/ 347
METRIC RANK
$92,872
MEDIAN FAMILY INCOME
0.7/ 100
METRIC RATING
248th/ 347
METRIC RANK
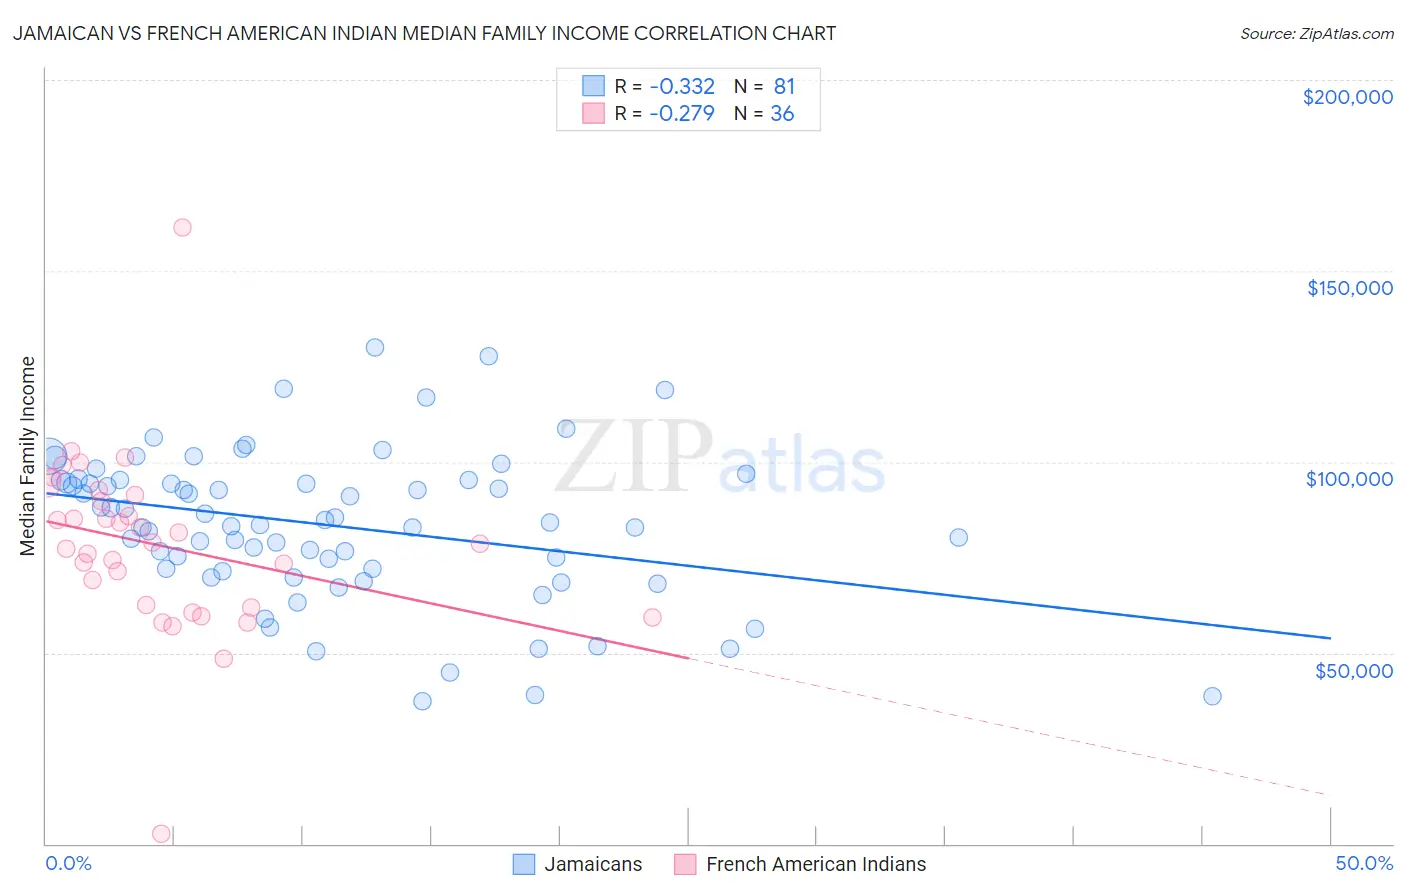
Jamaican vs French American Indian Median Family Income Correlation Chart
The statistical analysis conducted on geographies consisting of 367,485,053 people shows a mild negative correlation between the proportion of Jamaicans and median family income in the United States with a correlation coefficient (R) of -0.332 and weighted average of $90,581. Similarly, the statistical analysis conducted on geographies consisting of 131,949,882 people shows a weak negative correlation between the proportion of French American Indians and median family income in the United States with a correlation coefficient (R) of -0.279 and weighted average of $92,872, a difference of 2.5%.
Median Family Income Correlation Summary
| Measurement | Jamaican | French American Indian |
| Minimum | $37,461 | $2,499 |
| Maximum | $130,066 | $161,250 |
| Range | $92,605 | $158,751 |
| Mean | $83,374 | $78,273 |
| Median | $84,019 | $78,700 |
| Interquartile 25% (IQ1) | $71,528 | $62,262 |
| Interquartile 75% (IQ3) | $95,163 | $90,496 |
| Interquartile Range (IQR) | $23,635 | $28,234 |
| Standard Deviation (Sample) | $19,598 | $23,852 |
| Standard Deviation (Population) | $19,477 | $23,519 |
Similar Demographics by Median Family Income
Demographics Similar to Jamaicans by Median Family Income
In terms of median family income, the demographic groups most similar to Jamaicans are Iroquois ($90,543, a difference of 0.040%), Immigrants from Liberia ($90,450, a difference of 0.14%), Immigrants from Micronesia ($90,345, a difference of 0.26%), Spanish American ($90,322, a difference of 0.29%), and Cree ($90,882, a difference of 0.33%).
| Demographics | Rating | Rank | Median Family Income |
| Immigrants | West Indies | 0.3 /100 | #263 | Tragic $91,588 |
| Senegalese | 0.3 /100 | #264 | Tragic $91,475 |
| Hmong | 0.3 /100 | #265 | Tragic $91,296 |
| Central Americans | 0.3 /100 | #266 | Tragic $91,087 |
| Mexican American Indians | 0.2 /100 | #267 | Tragic $90,918 |
| Cree | 0.2 /100 | #268 | Tragic $90,882 |
| Belizeans | 0.2 /100 | #269 | Tragic $90,880 |
| Jamaicans | 0.2 /100 | #270 | Tragic $90,581 |
| Iroquois | 0.2 /100 | #271 | Tragic $90,543 |
| Immigrants | Liberia | 0.2 /100 | #272 | Tragic $90,450 |
| Immigrants | Micronesia | 0.2 /100 | #273 | Tragic $90,345 |
| Spanish Americans | 0.2 /100 | #274 | Tragic $90,322 |
| Immigrants | St. Vincent and the Grenadines | 0.2 /100 | #275 | Tragic $90,094 |
| Immigrants | Zaire | 0.1 /100 | #276 | Tragic $89,285 |
| Immigrants | Jamaica | 0.1 /100 | #277 | Tragic $89,268 |
Demographics Similar to French American Indians by Median Family Income
In terms of median family income, the demographic groups most similar to French American Indians are Immigrants from Senegal ($92,912, a difference of 0.040%), Immigrants from Ecuador ($92,837, a difference of 0.040%), West Indian ($92,765, a difference of 0.11%), Immigrants from Somalia ($92,609, a difference of 0.28%), and Immigrants from El Salvador ($92,545, a difference of 0.35%).
| Demographics | Rating | Rank | Median Family Income |
| Immigrants | Trinidad and Tobago | 1.2 /100 | #241 | Tragic $93,988 |
| Barbadians | 1.1 /100 | #242 | Tragic $93,919 |
| German Russians | 1.1 /100 | #243 | Tragic $93,858 |
| Sub-Saharan Africans | 1.0 /100 | #244 | Tragic $93,748 |
| Immigrants | Middle Africa | 1.0 /100 | #245 | Tragic $93,593 |
| Guyanese | 0.9 /100 | #246 | Tragic $93,373 |
| Immigrants | Senegal | 0.7 /100 | #247 | Tragic $92,912 |
| French American Indians | 0.7 /100 | #248 | Tragic $92,872 |
| Immigrants | Ecuador | 0.7 /100 | #249 | Tragic $92,837 |
| West Indians | 0.6 /100 | #250 | Tragic $92,765 |
| Immigrants | Somalia | 0.6 /100 | #251 | Tragic $92,609 |
| Immigrants | El Salvador | 0.6 /100 | #252 | Tragic $92,545 |
| Immigrants | Guyana | 0.6 /100 | #253 | Tragic $92,513 |
| Immigrants | Barbados | 0.5 /100 | #254 | Tragic $92,419 |
| Immigrants | Laos | 0.5 /100 | #255 | Tragic $92,239 |