Jamaican vs Mongolian Median Family Income
COMPARE
Jamaican
Mongolian
Median Family Income
Median Family Income Comparison
Jamaicans
Mongolians
$90,581
MEDIAN FAMILY INCOME
0.2/ 100
METRIC RATING
270th/ 347
METRIC RANK
$114,553
MEDIAN FAMILY INCOME
99.8/ 100
METRIC RATING
62nd/ 347
METRIC RANK
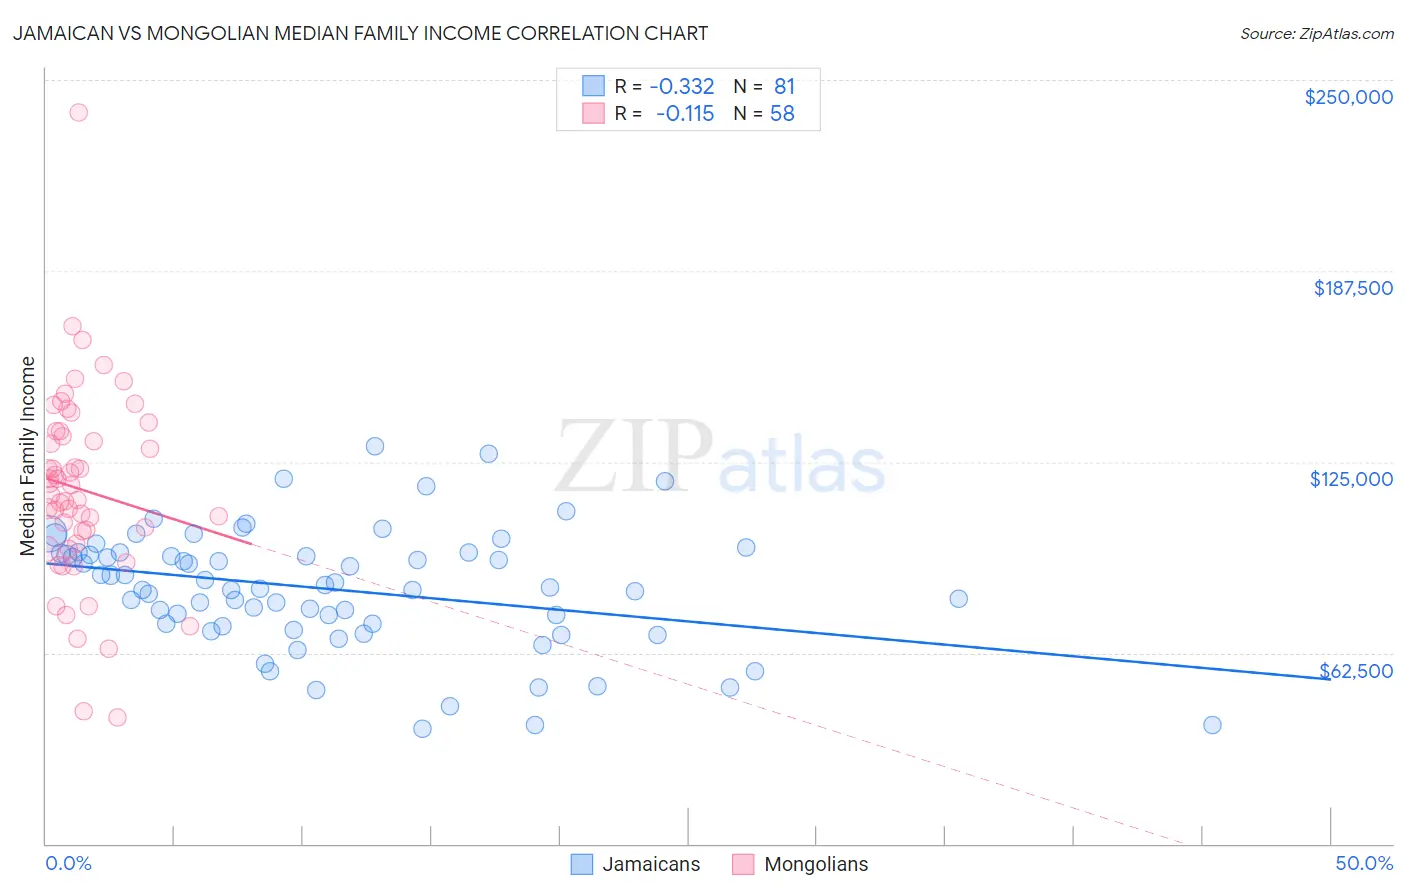
Jamaican vs Mongolian Median Family Income Correlation Chart
The statistical analysis conducted on geographies consisting of 367,485,053 people shows a mild negative correlation between the proportion of Jamaicans and median family income in the United States with a correlation coefficient (R) of -0.332 and weighted average of $90,581. Similarly, the statistical analysis conducted on geographies consisting of 140,257,208 people shows a poor negative correlation between the proportion of Mongolians and median family income in the United States with a correlation coefficient (R) of -0.115 and weighted average of $114,553, a difference of 26.5%.
Median Family Income Correlation Summary
| Measurement | Jamaican | Mongolian |
| Minimum | $37,461 | $41,389 |
| Maximum | $130,066 | $239,335 |
| Range | $92,605 | $197,946 |
| Mean | $83,374 | $115,974 |
| Median | $84,019 | $115,745 |
| Interquartile 25% (IQ1) | $71,528 | $98,398 |
| Interquartile 75% (IQ3) | $95,163 | $135,066 |
| Interquartile Range (IQR) | $23,635 | $36,668 |
| Standard Deviation (Sample) | $19,598 | $32,155 |
| Standard Deviation (Population) | $19,477 | $31,876 |
Similar Demographics by Median Family Income
Demographics Similar to Jamaicans by Median Family Income
In terms of median family income, the demographic groups most similar to Jamaicans are Iroquois ($90,543, a difference of 0.040%), Immigrants from Liberia ($90,450, a difference of 0.14%), Immigrants from Micronesia ($90,345, a difference of 0.26%), Spanish American ($90,322, a difference of 0.29%), and Cree ($90,882, a difference of 0.33%).
| Demographics | Rating | Rank | Median Family Income |
| Immigrants | West Indies | 0.3 /100 | #263 | Tragic $91,588 |
| Senegalese | 0.3 /100 | #264 | Tragic $91,475 |
| Hmong | 0.3 /100 | #265 | Tragic $91,296 |
| Central Americans | 0.3 /100 | #266 | Tragic $91,087 |
| Mexican American Indians | 0.2 /100 | #267 | Tragic $90,918 |
| Cree | 0.2 /100 | #268 | Tragic $90,882 |
| Belizeans | 0.2 /100 | #269 | Tragic $90,880 |
| Jamaicans | 0.2 /100 | #270 | Tragic $90,581 |
| Iroquois | 0.2 /100 | #271 | Tragic $90,543 |
| Immigrants | Liberia | 0.2 /100 | #272 | Tragic $90,450 |
| Immigrants | Micronesia | 0.2 /100 | #273 | Tragic $90,345 |
| Spanish Americans | 0.2 /100 | #274 | Tragic $90,322 |
| Immigrants | St. Vincent and the Grenadines | 0.2 /100 | #275 | Tragic $90,094 |
| Immigrants | Zaire | 0.1 /100 | #276 | Tragic $89,285 |
| Immigrants | Jamaica | 0.1 /100 | #277 | Tragic $89,268 |
Demographics Similar to Mongolians by Median Family Income
In terms of median family income, the demographic groups most similar to Mongolians are Immigrants from Belarus ($114,586, a difference of 0.030%), Immigrants from Pakistan ($114,406, a difference of 0.13%), Immigrants from Scotland ($114,392, a difference of 0.14%), Immigrants from Latvia ($114,826, a difference of 0.24%), and Immigrants from Netherlands ($114,987, a difference of 0.38%).
| Demographics | Rating | Rank | Median Family Income |
| Lithuanians | 99.8 /100 | #55 | Exceptional $115,395 |
| New Zealanders | 99.8 /100 | #56 | Exceptional $115,230 |
| Greeks | 99.8 /100 | #57 | Exceptional $115,192 |
| Immigrants | Indonesia | 99.8 /100 | #58 | Exceptional $115,162 |
| Immigrants | Netherlands | 99.8 /100 | #59 | Exceptional $114,987 |
| Immigrants | Latvia | 99.8 /100 | #60 | Exceptional $114,826 |
| Immigrants | Belarus | 99.8 /100 | #61 | Exceptional $114,586 |
| Mongolians | 99.8 /100 | #62 | Exceptional $114,553 |
| Immigrants | Pakistan | 99.8 /100 | #63 | Exceptional $114,406 |
| Immigrants | Scotland | 99.7 /100 | #64 | Exceptional $114,392 |
| Egyptians | 99.7 /100 | #65 | Exceptional $114,119 |
| Paraguayans | 99.7 /100 | #66 | Exceptional $114,016 |
| Immigrants | Spain | 99.7 /100 | #67 | Exceptional $113,815 |
| Immigrants | Serbia | 99.6 /100 | #68 | Exceptional $113,463 |
| Immigrants | Bulgaria | 99.6 /100 | #69 | Exceptional $113,461 |