Egyptian vs Immigrants from Panama Median Family Income
COMPARE
Egyptian
Immigrants from Panama
Median Family Income
Median Family Income Comparison
Egyptians
Immigrants from Panama
$114,119
MEDIAN FAMILY INCOME
99.7/ 100
METRIC RATING
65th/ 347
METRIC RANK
$95,647
MEDIAN FAMILY INCOME
2.7/ 100
METRIC RATING
226th/ 347
METRIC RANK
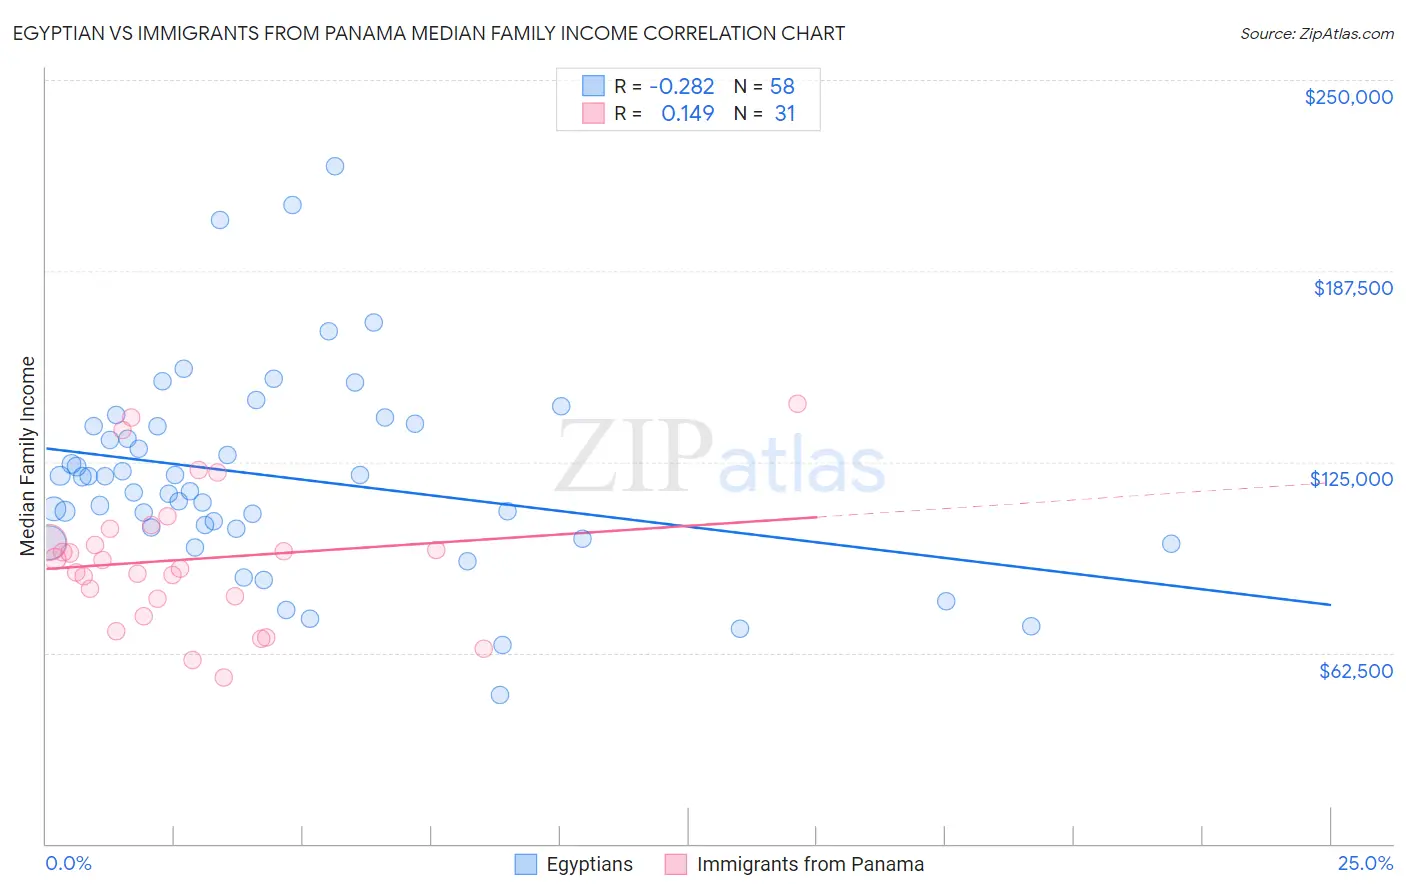
Egyptian vs Immigrants from Panama Median Family Income Correlation Chart
The statistical analysis conducted on geographies consisting of 276,687,434 people shows a weak negative correlation between the proportion of Egyptians and median family income in the United States with a correlation coefficient (R) of -0.282 and weighted average of $114,119. Similarly, the statistical analysis conducted on geographies consisting of 221,145,724 people shows a poor positive correlation between the proportion of Immigrants from Panama and median family income in the United States with a correlation coefficient (R) of 0.149 and weighted average of $95,647, a difference of 19.3%.
Median Family Income Correlation Summary
| Measurement | Egyptian | Immigrants from Panama |
| Minimum | $48,661 | $54,583 |
| Maximum | $221,912 | $143,854 |
| Range | $173,251 | $89,271 |
| Mean | $119,991 | $93,119 |
| Median | $117,654 | $92,830 |
| Interquartile 25% (IQ1) | $103,125 | $80,245 |
| Interquartile 75% (IQ3) | $136,794 | $103,110 |
| Interquartile Range (IQR) | $33,669 | $22,865 |
| Standard Deviation (Sample) | $33,329 | $22,241 |
| Standard Deviation (Population) | $33,040 | $21,880 |
Similar Demographics by Median Family Income
Demographics Similar to Egyptians by Median Family Income
In terms of median family income, the demographic groups most similar to Egyptians are Paraguayan ($114,016, a difference of 0.090%), Immigrants from Scotland ($114,392, a difference of 0.24%), Immigrants from Pakistan ($114,406, a difference of 0.25%), Immigrants from Spain ($113,815, a difference of 0.27%), and Mongolian ($114,553, a difference of 0.38%).
| Demographics | Rating | Rank | Median Family Income |
| Immigrants | Indonesia | 99.8 /100 | #58 | Exceptional $115,162 |
| Immigrants | Netherlands | 99.8 /100 | #59 | Exceptional $114,987 |
| Immigrants | Latvia | 99.8 /100 | #60 | Exceptional $114,826 |
| Immigrants | Belarus | 99.8 /100 | #61 | Exceptional $114,586 |
| Mongolians | 99.8 /100 | #62 | Exceptional $114,553 |
| Immigrants | Pakistan | 99.8 /100 | #63 | Exceptional $114,406 |
| Immigrants | Scotland | 99.7 /100 | #64 | Exceptional $114,392 |
| Egyptians | 99.7 /100 | #65 | Exceptional $114,119 |
| Paraguayans | 99.7 /100 | #66 | Exceptional $114,016 |
| Immigrants | Spain | 99.7 /100 | #67 | Exceptional $113,815 |
| Immigrants | Serbia | 99.6 /100 | #68 | Exceptional $113,463 |
| Immigrants | Bulgaria | 99.6 /100 | #69 | Exceptional $113,461 |
| Immigrants | Romania | 99.6 /100 | #70 | Exceptional $113,434 |
| South Africans | 99.5 /100 | #71 | Exceptional $113,229 |
| Afghans | 99.5 /100 | #72 | Exceptional $112,971 |
Demographics Similar to Immigrants from Panama by Median Family Income
In terms of median family income, the demographic groups most similar to Immigrants from Panama are Alaska Native ($95,573, a difference of 0.080%), Immigrants from the Azores ($95,402, a difference of 0.26%), Marshallese ($95,293, a difference of 0.37%), Malaysian ($95,230, a difference of 0.44%), and Vietnamese ($96,123, a difference of 0.50%).
| Demographics | Rating | Rank | Median Family Income |
| Delaware | 5.1 /100 | #219 | Tragic $96,958 |
| Sudanese | 4.7 /100 | #220 | Tragic $96,783 |
| Immigrants | Ghana | 4.2 /100 | #221 | Tragic $96,544 |
| Immigrants | Nigeria | 4.0 /100 | #222 | Tragic $96,439 |
| Venezuelans | 3.7 /100 | #223 | Tragic $96,281 |
| Immigrants | Nonimmigrants | 3.6 /100 | #224 | Tragic $96,231 |
| Vietnamese | 3.4 /100 | #225 | Tragic $96,123 |
| Immigrants | Panama | 2.7 /100 | #226 | Tragic $95,647 |
| Alaska Natives | 2.6 /100 | #227 | Tragic $95,573 |
| Immigrants | Azores | 2.4 /100 | #228 | Tragic $95,402 |
| Marshallese | 2.2 /100 | #229 | Tragic $95,293 |
| Malaysians | 2.2 /100 | #230 | Tragic $95,230 |
| Ecuadorians | 2.1 /100 | #231 | Tragic $95,114 |
| Immigrants | Venezuela | 1.9 /100 | #232 | Tragic $94,904 |
| Immigrants | Bangladesh | 1.6 /100 | #233 | Tragic $94,665 |