Japanese vs Immigrants from Panama Median Family Income
COMPARE
Japanese
Immigrants from Panama
Median Family Income
Median Family Income Comparison
Japanese
Immigrants from Panama
$97,288
MEDIAN FAMILY INCOME
6.0/ 100
METRIC RATING
217th/ 347
METRIC RANK
$95,647
MEDIAN FAMILY INCOME
2.7/ 100
METRIC RATING
226th/ 347
METRIC RANK
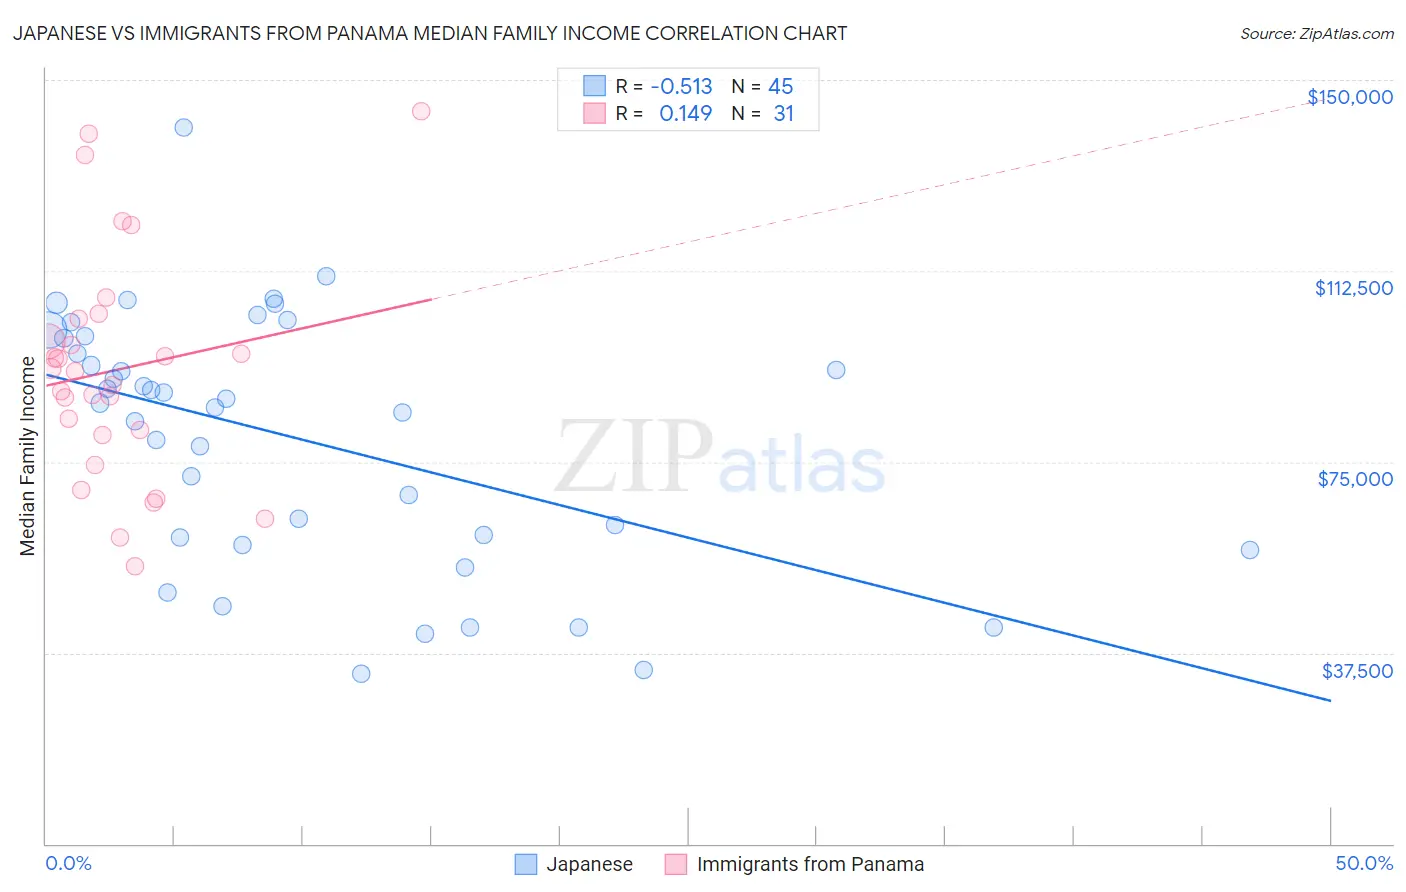
Japanese vs Immigrants from Panama Median Family Income Correlation Chart
The statistical analysis conducted on geographies consisting of 249,024,827 people shows a substantial negative correlation between the proportion of Japanese and median family income in the United States with a correlation coefficient (R) of -0.513 and weighted average of $97,288. Similarly, the statistical analysis conducted on geographies consisting of 221,145,724 people shows a poor positive correlation between the proportion of Immigrants from Panama and median family income in the United States with a correlation coefficient (R) of 0.149 and weighted average of $95,647, a difference of 1.7%.
Median Family Income Correlation Summary
| Measurement | Japanese | Immigrants from Panama |
| Minimum | $33,448 | $54,583 |
| Maximum | $140,649 | $143,854 |
| Range | $107,201 | $89,271 |
| Mean | $79,706 | $93,119 |
| Median | $86,545 | $92,830 |
| Interquartile 25% (IQ1) | $59,337 | $80,245 |
| Interquartile 75% (IQ3) | $99,518 | $103,110 |
| Interquartile Range (IQR) | $40,181 | $22,865 |
| Standard Deviation (Sample) | $24,734 | $22,241 |
| Standard Deviation (Population) | $24,457 | $21,880 |
Demographics Similar to Japanese and Immigrants from Panama by Median Family Income
In terms of median family income, the demographic groups most similar to Japanese are Immigrants from Cambodia ($97,222, a difference of 0.070%), Immigrants from Bosnia and Herzegovina ($97,432, a difference of 0.15%), Nigerian ($97,522, a difference of 0.24%), Bermudan ($97,577, a difference of 0.30%), and Immigrants from Armenia ($97,605, a difference of 0.33%). Similarly, the demographic groups most similar to Immigrants from Panama are Alaska Native ($95,573, a difference of 0.080%), Immigrants from the Azores ($95,402, a difference of 0.26%), Marshallese ($95,293, a difference of 0.37%), Malaysian ($95,230, a difference of 0.44%), and Vietnamese ($96,123, a difference of 0.50%).
| Demographics | Rating | Rank | Median Family Income |
| Immigrants | Sudan | 7.4 /100 | #211 | Tragic $97,737 |
| Panamanians | 7.2 /100 | #212 | Tragic $97,683 |
| Immigrants | Armenia | 7.0 /100 | #213 | Tragic $97,605 |
| Bermudans | 6.9 /100 | #214 | Tragic $97,577 |
| Nigerians | 6.7 /100 | #215 | Tragic $97,522 |
| Immigrants | Bosnia and Herzegovina | 6.4 /100 | #216 | Tragic $97,432 |
| Japanese | 6.0 /100 | #217 | Tragic $97,288 |
| Immigrants | Cambodia | 5.8 /100 | #218 | Tragic $97,222 |
| Delaware | 5.1 /100 | #219 | Tragic $96,958 |
| Sudanese | 4.7 /100 | #220 | Tragic $96,783 |
| Immigrants | Ghana | 4.2 /100 | #221 | Tragic $96,544 |
| Immigrants | Nigeria | 4.0 /100 | #222 | Tragic $96,439 |
| Venezuelans | 3.7 /100 | #223 | Tragic $96,281 |
| Immigrants | Nonimmigrants | 3.6 /100 | #224 | Tragic $96,231 |
| Vietnamese | 3.4 /100 | #225 | Tragic $96,123 |
| Immigrants | Panama | 2.7 /100 | #226 | Tragic $95,647 |
| Alaska Natives | 2.6 /100 | #227 | Tragic $95,573 |
| Immigrants | Azores | 2.4 /100 | #228 | Tragic $95,402 |
| Marshallese | 2.2 /100 | #229 | Tragic $95,293 |
| Malaysians | 2.2 /100 | #230 | Tragic $95,230 |
| Ecuadorians | 2.1 /100 | #231 | Tragic $95,114 |