Jamaican vs Immigrants from Panama Vision Disability
COMPARE
Jamaican
Immigrants from Panama
Vision Disability
Vision Disability Comparison
Jamaicans
Immigrants from Panama
2.4%
VISION DISABILITY
0.1/ 100
METRIC RATING
262nd/ 347
METRIC RANK
2.3%
VISION DISABILITY
0.8/ 100
METRIC RATING
242nd/ 347
METRIC RANK
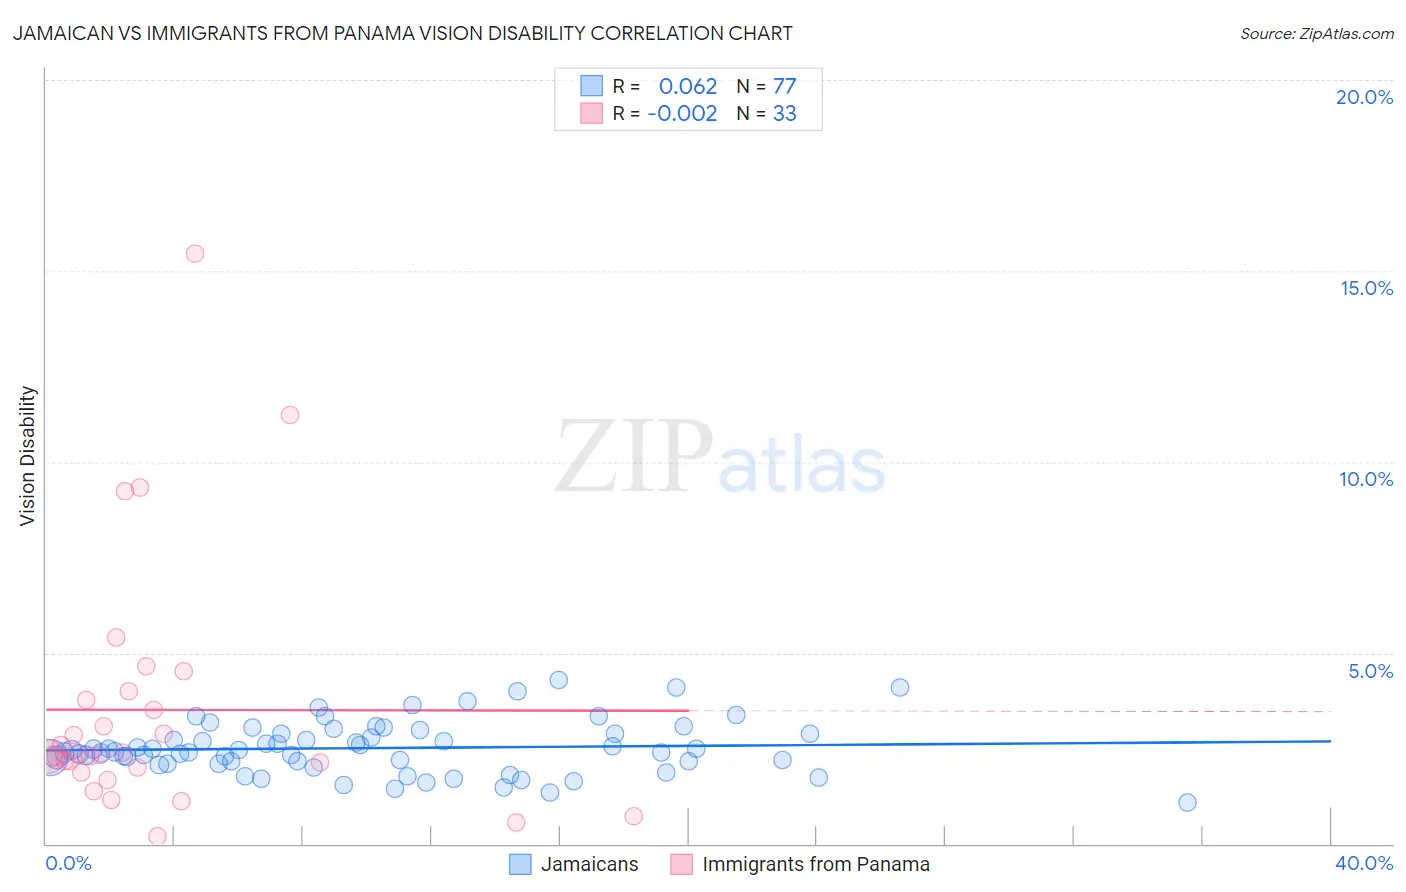
Jamaican vs Immigrants from Panama Vision Disability Correlation Chart
The statistical analysis conducted on geographies consisting of 367,713,681 people shows a slight positive correlation between the proportion of Jamaicans and percentage of population with vision disability in the United States with a correlation coefficient (R) of 0.062 and weighted average of 2.4%. Similarly, the statistical analysis conducted on geographies consisting of 221,144,457 people shows no correlation between the proportion of Immigrants from Panama and percentage of population with vision disability in the United States with a correlation coefficient (R) of -0.002 and weighted average of 2.3%, a difference of 2.6%.
Vision Disability Correlation Summary
| Measurement | Jamaican | Immigrants from Panama |
| Minimum | 1.1% | 0.19% |
| Maximum | 4.3% | 15.5% |
| Range | 3.2% | 15.3% |
| Mean | 2.5% | 3.5% |
| Median | 2.4% | 2.3% |
| Interquartile 25% (IQ1) | 2.1% | 1.9% |
| Interquartile 75% (IQ3) | 2.9% | 3.9% |
| Interquartile Range (IQR) | 0.76% | 1.9% |
| Standard Deviation (Sample) | 0.67% | 3.3% |
| Standard Deviation (Population) | 0.67% | 3.2% |
Demographics Similar to Jamaicans and Immigrants from Panama by Vision Disability
In terms of vision disability, the demographic groups most similar to Jamaicans are Fijian (2.4%, a difference of 0.030%), Belizean (2.4%, a difference of 0.24%), White/Caucasian (2.4%, a difference of 0.41%), British West Indian (2.4%, a difference of 0.42%), and West Indian (2.4%, a difference of 0.45%). Similarly, the demographic groups most similar to Immigrants from Panama are Immigrants from Nicaragua (2.3%, a difference of 0.48%), Immigrants from West Indies (2.3%, a difference of 0.48%), Alsatian (2.3%, a difference of 0.57%), French (2.3%, a difference of 0.72%), and Guatemalan (2.3%, a difference of 0.76%).
| Demographics | Rating | Rank | Vision Disability |
| Immigrants | Panama | 0.8 /100 | #242 | Tragic 2.3% |
| Immigrants | Nicaragua | 0.6 /100 | #243 | Tragic 2.3% |
| Immigrants | West Indies | 0.6 /100 | #244 | Tragic 2.3% |
| Alsatians | 0.6 /100 | #245 | Tragic 2.3% |
| French | 0.5 /100 | #246 | Tragic 2.3% |
| Guatemalans | 0.5 /100 | #247 | Tragic 2.3% |
| Sub-Saharan Africans | 0.5 /100 | #248 | Tragic 2.3% |
| Liberians | 0.5 /100 | #249 | Tragic 2.3% |
| Bangladeshis | 0.5 /100 | #250 | Tragic 2.3% |
| Immigrants | Laos | 0.4 /100 | #251 | Tragic 2.4% |
| Immigrants | Micronesia | 0.3 /100 | #252 | Tragic 2.4% |
| Japanese | 0.3 /100 | #253 | Tragic 2.4% |
| Haitians | 0.3 /100 | #254 | Tragic 2.4% |
| Immigrants | Guatemala | 0.3 /100 | #255 | Tragic 2.4% |
| Immigrants | Haiti | 0.2 /100 | #256 | Tragic 2.4% |
| West Indians | 0.2 /100 | #257 | Tragic 2.4% |
| British West Indians | 0.2 /100 | #258 | Tragic 2.4% |
| Whites/Caucasians | 0.2 /100 | #259 | Tragic 2.4% |
| Belizeans | 0.2 /100 | #260 | Tragic 2.4% |
| Fijians | 0.1 /100 | #261 | Tragic 2.4% |
| Jamaicans | 0.1 /100 | #262 | Tragic 2.4% |