Jamaican vs Lumbee Median Family Income
COMPARE
Jamaican
Lumbee
Median Family Income
Median Family Income Comparison
Jamaicans
Lumbee
$90,581
MEDIAN FAMILY INCOME
0.2/ 100
METRIC RATING
270th/ 347
METRIC RANK
$68,679
MEDIAN FAMILY INCOME
0.0/ 100
METRIC RATING
347th/ 347
METRIC RANK
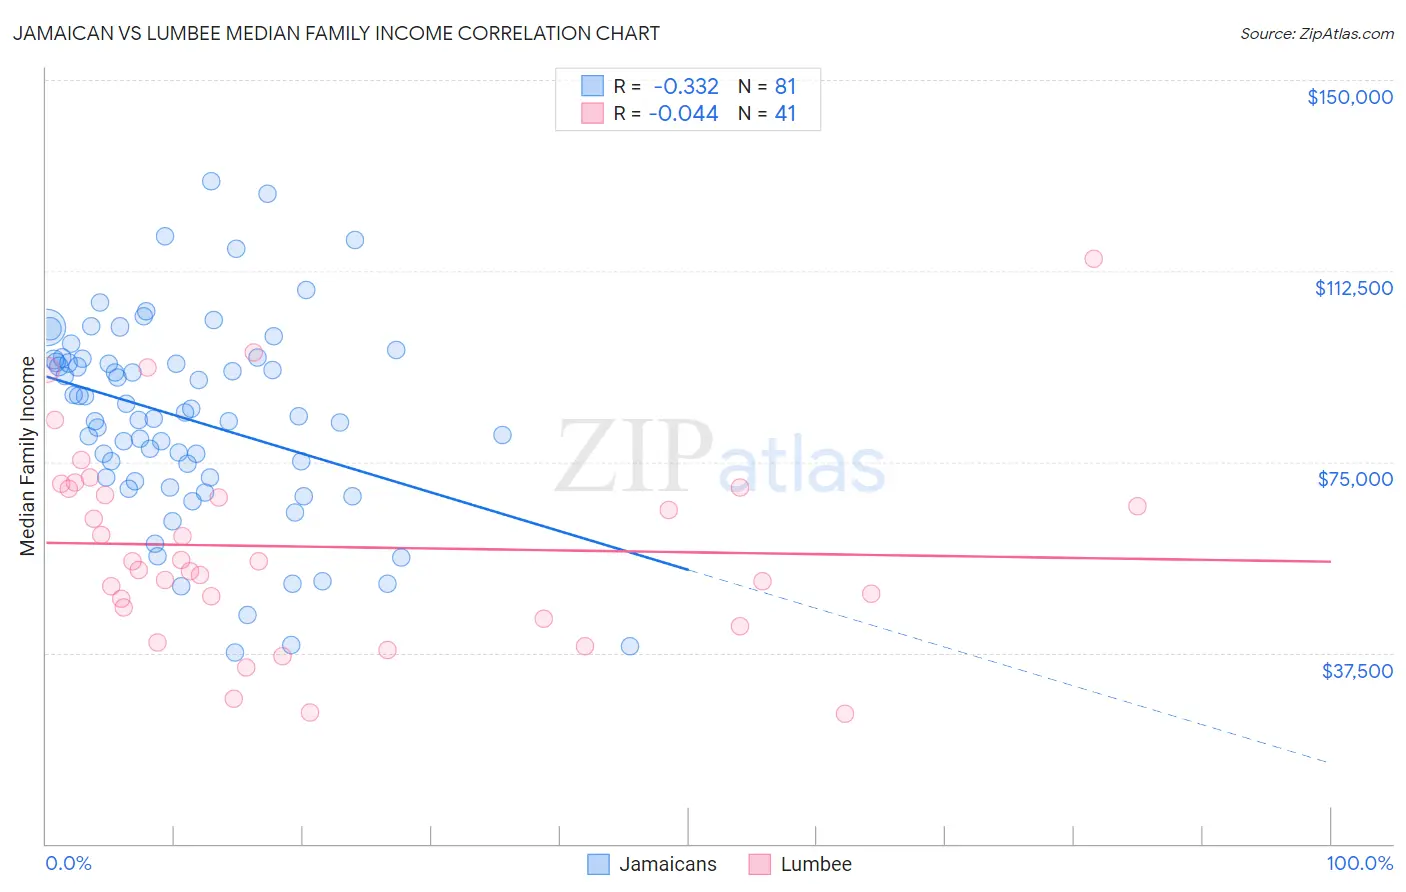
Jamaican vs Lumbee Median Family Income Correlation Chart
The statistical analysis conducted on geographies consisting of 367,485,053 people shows a mild negative correlation between the proportion of Jamaicans and median family income in the United States with a correlation coefficient (R) of -0.332 and weighted average of $90,581. Similarly, the statistical analysis conducted on geographies consisting of 92,247,043 people shows no correlation between the proportion of Lumbee and median family income in the United States with a correlation coefficient (R) of -0.044 and weighted average of $68,679, a difference of 31.9%.
Median Family Income Correlation Summary
| Measurement | Jamaican | Lumbee |
| Minimum | $37,461 | $25,481 |
| Maximum | $130,066 | $114,792 |
| Range | $92,605 | $89,311 |
| Mean | $83,374 | $58,324 |
| Median | $84,019 | $55,406 |
| Interquartile 25% (IQ1) | $71,528 | $45,288 |
| Interquartile 75% (IQ3) | $95,163 | $69,902 |
| Interquartile Range (IQR) | $23,635 | $24,614 |
| Standard Deviation (Sample) | $19,598 | $19,662 |
| Standard Deviation (Population) | $19,477 | $19,420 |
Similar Demographics by Median Family Income
Demographics Similar to Jamaicans by Median Family Income
In terms of median family income, the demographic groups most similar to Jamaicans are Iroquois ($90,543, a difference of 0.040%), Immigrants from Liberia ($90,450, a difference of 0.14%), Immigrants from Micronesia ($90,345, a difference of 0.26%), Spanish American ($90,322, a difference of 0.29%), and Cree ($90,882, a difference of 0.33%).
| Demographics | Rating | Rank | Median Family Income |
| Immigrants | West Indies | 0.3 /100 | #263 | Tragic $91,588 |
| Senegalese | 0.3 /100 | #264 | Tragic $91,475 |
| Hmong | 0.3 /100 | #265 | Tragic $91,296 |
| Central Americans | 0.3 /100 | #266 | Tragic $91,087 |
| Mexican American Indians | 0.2 /100 | #267 | Tragic $90,918 |
| Cree | 0.2 /100 | #268 | Tragic $90,882 |
| Belizeans | 0.2 /100 | #269 | Tragic $90,880 |
| Jamaicans | 0.2 /100 | #270 | Tragic $90,581 |
| Iroquois | 0.2 /100 | #271 | Tragic $90,543 |
| Immigrants | Liberia | 0.2 /100 | #272 | Tragic $90,450 |
| Immigrants | Micronesia | 0.2 /100 | #273 | Tragic $90,345 |
| Spanish Americans | 0.2 /100 | #274 | Tragic $90,322 |
| Immigrants | St. Vincent and the Grenadines | 0.2 /100 | #275 | Tragic $90,094 |
| Immigrants | Zaire | 0.1 /100 | #276 | Tragic $89,285 |
| Immigrants | Jamaica | 0.1 /100 | #277 | Tragic $89,268 |
Demographics Similar to Lumbee by Median Family Income
In terms of median family income, the demographic groups most similar to Lumbee are Puerto Rican ($70,423, a difference of 2.5%), Navajo ($70,989, a difference of 3.4%), Tohono O'odham ($72,193, a difference of 5.1%), Houma ($76,188, a difference of 10.9%), and Crow ($76,605, a difference of 11.5%).
| Demographics | Rating | Rank | Median Family Income |
| Kiowa | 0.0 /100 | #333 | Tragic $80,885 |
| Menominee | 0.0 /100 | #334 | Tragic $79,563 |
| Yup'ik | 0.0 /100 | #335 | Tragic $79,290 |
| Immigrants | Cuba | 0.0 /100 | #336 | Tragic $78,249 |
| Yuman | 0.0 /100 | #337 | Tragic $78,055 |
| Immigrants | Yemen | 0.0 /100 | #338 | Tragic $77,457 |
| Pima | 0.0 /100 | #339 | Tragic $77,431 |
| Hopi | 0.0 /100 | #340 | Tragic $77,188 |
| Pueblo | 0.0 /100 | #341 | Tragic $76,880 |
| Crow | 0.0 /100 | #342 | Tragic $76,605 |
| Houma | 0.0 /100 | #343 | Tragic $76,188 |
| Tohono O'odham | 0.0 /100 | #344 | Tragic $72,193 |
| Navajo | 0.0 /100 | #345 | Tragic $70,989 |
| Puerto Ricans | 0.0 /100 | #346 | Tragic $70,423 |
| Lumbee | 0.0 /100 | #347 | Tragic $68,679 |