Iranian vs Immigrants from St. Vincent and the Grenadines Male Unemployment
COMPARE
Iranian
Immigrants from St. Vincent and the Grenadines
Male Unemployment
Male Unemployment Comparison
Iranians
Immigrants from St. Vincent and the Grenadines
5.0%
MALE UNEMPLOYMENT
96.4/ 100
METRIC RATING
77th/ 347
METRIC RANK
7.5%
MALE UNEMPLOYMENT
0.0/ 100
METRIC RATING
321st/ 347
METRIC RANK
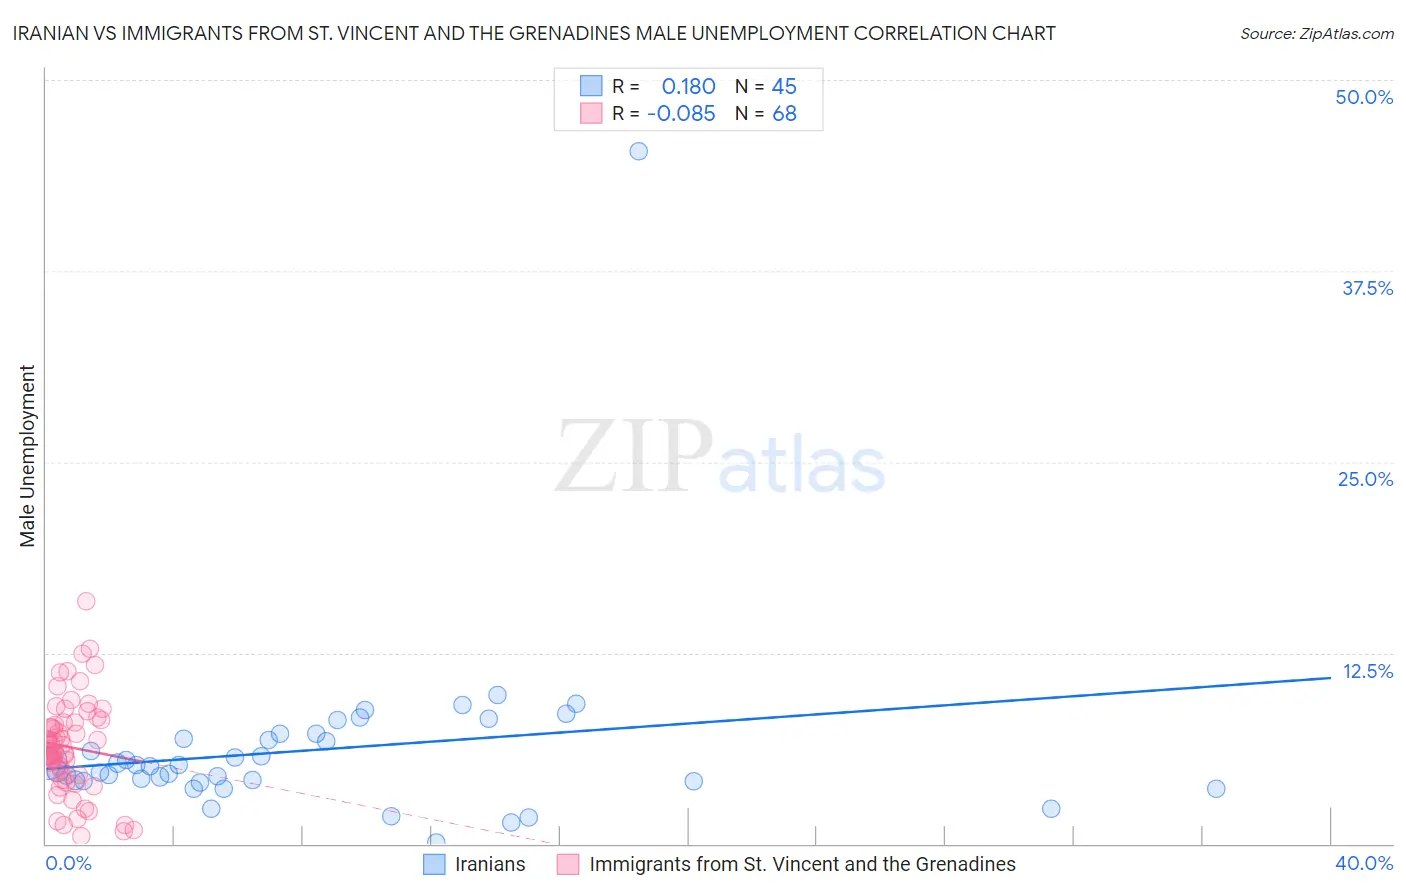
Iranian vs Immigrants from St. Vincent and the Grenadines Male Unemployment Correlation Chart
The statistical analysis conducted on geographies consisting of 316,157,253 people shows a poor positive correlation between the proportion of Iranians and unemployment rate among males in the United States with a correlation coefficient (R) of 0.180 and weighted average of 5.0%. Similarly, the statistical analysis conducted on geographies consisting of 56,141,446 people shows a slight negative correlation between the proportion of Immigrants from St. Vincent and the Grenadines and unemployment rate among males in the United States with a correlation coefficient (R) of -0.085 and weighted average of 7.5%, a difference of 48.1%.
Male Unemployment Correlation Summary
| Measurement | Iranian | Immigrants from St. Vincent and the Grenadines |
| Minimum | 0.10% | 0.50% |
| Maximum | 45.3% | 15.9% |
| Range | 45.2% | 15.4% |
| Mean | 6.1% | 6.3% |
| Median | 5.1% | 6.1% |
| Interquartile 25% (IQ1) | 4.1% | 4.6% |
| Interquartile 75% (IQ3) | 7.0% | 7.9% |
| Interquartile Range (IQR) | 2.9% | 3.3% |
| Standard Deviation (Sample) | 6.4% | 3.1% |
| Standard Deviation (Population) | 6.3% | 3.1% |
Similar Demographics by Male Unemployment
Demographics Similar to Iranians by Male Unemployment
In terms of male unemployment, the demographic groups most similar to Iranians are Immigrants from Northern Europe (5.0%, a difference of 0.010%), South African (5.0%, a difference of 0.020%), Immigrants from Sudan (5.0%, a difference of 0.050%), Argentinean (5.0%, a difference of 0.080%), and French (5.0%, a difference of 0.080%).
| Demographics | Rating | Rank | Male Unemployment |
| Whites/Caucasians | 97.3 /100 | #70 | Exceptional 5.0% |
| New Zealanders | 97.3 /100 | #71 | Exceptional 5.0% |
| Immigrants | South Africa | 97.1 /100 | #72 | Exceptional 5.0% |
| Greeks | 97.0 /100 | #73 | Exceptional 5.0% |
| Immigrants | North America | 96.9 /100 | #74 | Exceptional 5.0% |
| Assyrians/Chaldeans/Syriacs | 96.9 /100 | #75 | Exceptional 5.0% |
| Immigrants | Sudan | 96.5 /100 | #76 | Exceptional 5.0% |
| Iranians | 96.4 /100 | #77 | Exceptional 5.0% |
| Immigrants | Northern Europe | 96.4 /100 | #78 | Exceptional 5.0% |
| South Africans | 96.4 /100 | #79 | Exceptional 5.0% |
| Argentineans | 96.2 /100 | #80 | Exceptional 5.0% |
| French | 96.2 /100 | #81 | Exceptional 5.0% |
| Chileans | 96.2 /100 | #82 | Exceptional 5.0% |
| Immigrants | Eritrea | 96.0 /100 | #83 | Exceptional 5.0% |
| Serbians | 95.7 /100 | #84 | Exceptional 5.1% |
Demographics Similar to Immigrants from St. Vincent and the Grenadines by Male Unemployment
In terms of male unemployment, the demographic groups most similar to Immigrants from St. Vincent and the Grenadines are Immigrants from Cabo Verde (7.5%, a difference of 0.33%), Immigrants from Grenada (7.6%, a difference of 1.1%), Colville (7.4%, a difference of 1.4%), Dominican (7.6%, a difference of 1.4%), and Shoshone (7.6%, a difference of 1.8%).
| Demographics | Rating | Rank | Male Unemployment |
| Immigrants | Barbados | 0.0 /100 | #314 | Tragic 7.1% |
| Houma | 0.0 /100 | #315 | Tragic 7.1% |
| Immigrants | Guyana | 0.0 /100 | #316 | Tragic 7.1% |
| Guyanese | 0.0 /100 | #317 | Tragic 7.1% |
| Cape Verdeans | 0.0 /100 | #318 | Tragic 7.1% |
| British West Indians | 0.0 /100 | #319 | Tragic 7.3% |
| Colville | 0.0 /100 | #320 | Tragic 7.4% |
| Immigrants | St. Vincent and the Grenadines | 0.0 /100 | #321 | Tragic 7.5% |
| Immigrants | Cabo Verde | 0.0 /100 | #322 | Tragic 7.5% |
| Immigrants | Grenada | 0.0 /100 | #323 | Tragic 7.6% |
| Dominicans | 0.0 /100 | #324 | Tragic 7.6% |
| Shoshone | 0.0 /100 | #325 | Tragic 7.6% |
| Immigrants | Dominican Republic | 0.0 /100 | #326 | Tragic 7.6% |
| Paiute | 0.0 /100 | #327 | Tragic 7.7% |
| Natives/Alaskans | 0.0 /100 | #328 | Tragic 7.7% |