Immigrants from South America vs Immigrants from Kuwait Median Earnings
COMPARE
Immigrants from South America
Immigrants from Kuwait
Median Earnings
Median Earnings Comparison
Immigrants from South America
Immigrants from Kuwait
$46,548
MEDIAN EARNINGS
54.0/ 100
METRIC RATING
169th/ 347
METRIC RANK
$48,861
MEDIAN EARNINGS
96.8/ 100
METRIC RATING
113th/ 347
METRIC RANK
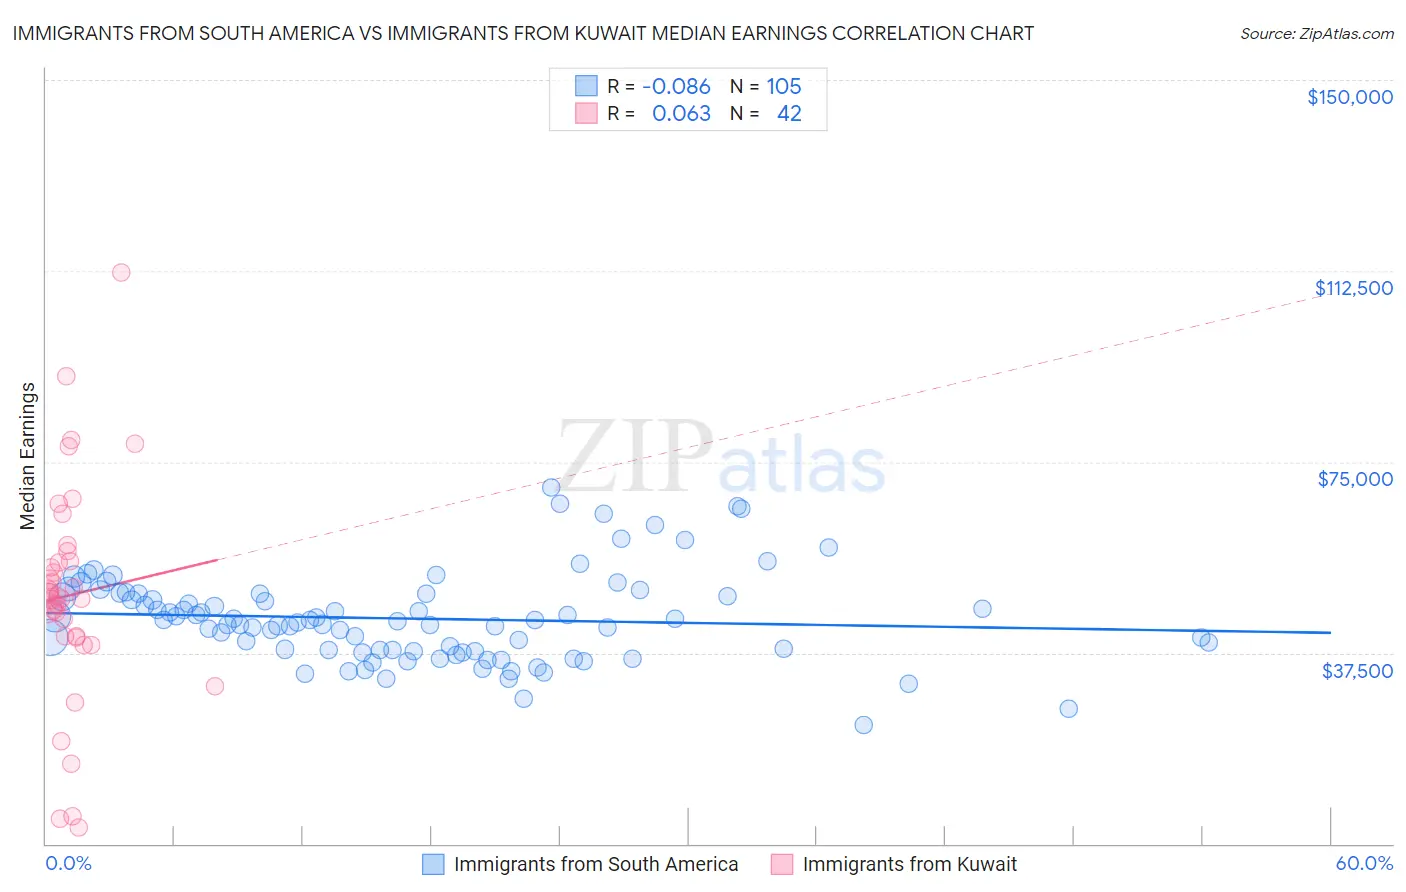
Immigrants from South America vs Immigrants from Kuwait Median Earnings Correlation Chart
The statistical analysis conducted on geographies consisting of 486,376,304 people shows a slight negative correlation between the proportion of Immigrants from South America and median earnings in the United States with a correlation coefficient (R) of -0.086 and weighted average of $46,548. Similarly, the statistical analysis conducted on geographies consisting of 136,904,336 people shows a slight positive correlation between the proportion of Immigrants from Kuwait and median earnings in the United States with a correlation coefficient (R) of 0.063 and weighted average of $48,861, a difference of 5.0%.
Median Earnings Correlation Summary
| Measurement | Immigrants from South America | Immigrants from Kuwait |
| Minimum | $23,314 | $3,079 |
| Maximum | $70,000 | $112,212 |
| Range | $46,686 | $109,133 |
| Mean | $44,228 | $48,846 |
| Median | $43,615 | $48,319 |
| Interquartile 25% (IQ1) | $37,956 | $40,771 |
| Interquartile 75% (IQ3) | $49,134 | $55,536 |
| Interquartile Range (IQR) | $11,178 | $14,765 |
| Standard Deviation (Sample) | $8,760 | $21,440 |
| Standard Deviation (Population) | $8,718 | $21,183 |
Similar Demographics by Median Earnings
Demographics Similar to Immigrants from South America by Median Earnings
In terms of median earnings, the demographic groups most similar to Immigrants from South America are Immigrants from Africa ($46,564, a difference of 0.030%), Immigrants ($46,478, a difference of 0.15%), Scottish ($46,463, a difference of 0.18%), Kenyan ($46,462, a difference of 0.18%), and Costa Rican ($46,645, a difference of 0.21%).
| Demographics | Rating | Rank | Median Earnings |
| South American Indians | 67.4 /100 | #162 | Good $46,952 |
| Icelanders | 66.3 /100 | #163 | Good $46,916 |
| Norwegians | 64.7 /100 | #164 | Good $46,865 |
| South Americans | 62.7 /100 | #165 | Good $46,804 |
| Czechoslovakians | 57.8 /100 | #166 | Average $46,658 |
| Costa Ricans | 57.4 /100 | #167 | Average $46,645 |
| Immigrants | Africa | 54.6 /100 | #168 | Average $46,564 |
| Immigrants | South America | 54.0 /100 | #169 | Average $46,548 |
| Immigrants | Immigrants | 51.6 /100 | #170 | Average $46,478 |
| Scottish | 51.1 /100 | #171 | Average $46,463 |
| Kenyans | 51.0 /100 | #172 | Average $46,462 |
| Ghanaians | 50.3 /100 | #173 | Average $46,440 |
| Scandinavians | 50.0 /100 | #174 | Average $46,433 |
| Basques | 48.8 /100 | #175 | Average $46,399 |
| Danes | 48.6 /100 | #176 | Average $46,392 |
Demographics Similar to Immigrants from Kuwait by Median Earnings
In terms of median earnings, the demographic groups most similar to Immigrants from Kuwait are Northern European ($48,887, a difference of 0.050%), Moroccan ($48,838, a difference of 0.050%), Chinese ($48,836, a difference of 0.050%), Immigrants from Zimbabwe ($48,913, a difference of 0.11%), and Immigrants from Ethiopia ($48,924, a difference of 0.13%).
| Demographics | Rating | Rank | Median Earnings |
| Immigrants | Albania | 98.4 /100 | #106 | Exceptional $49,377 |
| Immigrants | Morocco | 98.4 /100 | #107 | Exceptional $49,368 |
| Palestinians | 98.0 /100 | #108 | Exceptional $49,209 |
| Syrians | 97.1 /100 | #109 | Exceptional $48,934 |
| Immigrants | Ethiopia | 97.1 /100 | #110 | Exceptional $48,924 |
| Immigrants | Zimbabwe | 97.0 /100 | #111 | Exceptional $48,913 |
| Northern Europeans | 96.9 /100 | #112 | Exceptional $48,887 |
| Immigrants | Kuwait | 96.8 /100 | #113 | Exceptional $48,861 |
| Moroccans | 96.7 /100 | #114 | Exceptional $48,838 |
| Chinese | 96.7 /100 | #115 | Exceptional $48,836 |
| Koreans | 96.2 /100 | #116 | Exceptional $48,727 |
| Serbians | 95.9 /100 | #117 | Exceptional $48,677 |
| Immigrants | Jordan | 95.9 /100 | #118 | Exceptional $48,673 |
| Poles | 95.8 /100 | #119 | Exceptional $48,659 |
| Carpatho Rusyns | 95.5 /100 | #120 | Exceptional $48,617 |