Honduran vs Immigrants from Kuwait Median Earnings
COMPARE
Honduran
Immigrants from Kuwait
Median Earnings
Median Earnings Comparison
Hondurans
Immigrants from Kuwait
$40,638
MEDIAN EARNINGS
0.0/ 100
METRIC RATING
307th/ 347
METRIC RANK
$48,861
MEDIAN EARNINGS
96.8/ 100
METRIC RATING
113th/ 347
METRIC RANK
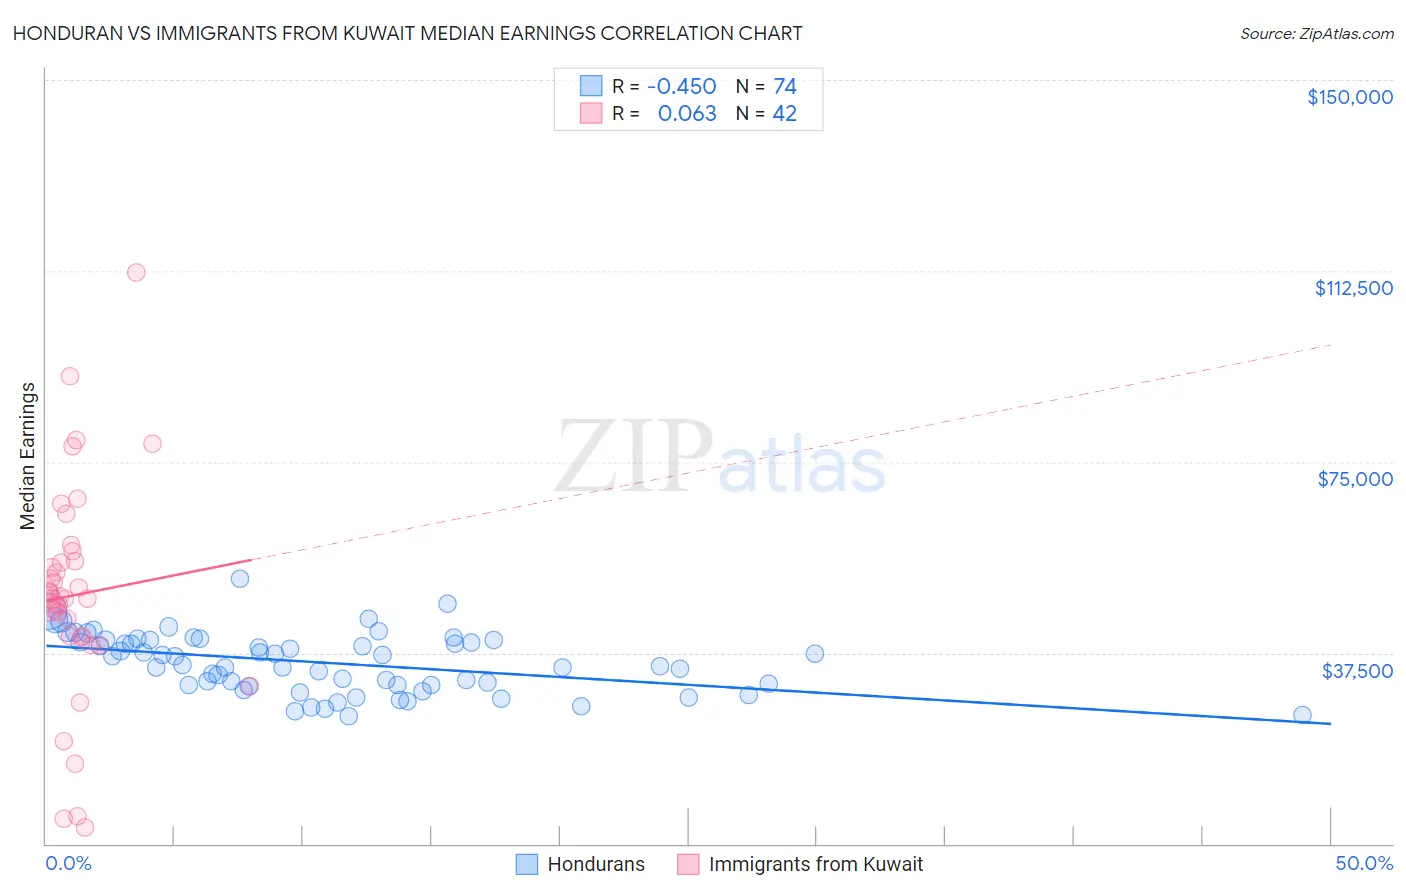
Honduran vs Immigrants from Kuwait Median Earnings Correlation Chart
The statistical analysis conducted on geographies consisting of 357,850,602 people shows a moderate negative correlation between the proportion of Hondurans and median earnings in the United States with a correlation coefficient (R) of -0.450 and weighted average of $40,638. Similarly, the statistical analysis conducted on geographies consisting of 136,904,336 people shows a slight positive correlation between the proportion of Immigrants from Kuwait and median earnings in the United States with a correlation coefficient (R) of 0.063 and weighted average of $48,861, a difference of 20.2%.
Median Earnings Correlation Summary
| Measurement | Honduran | Immigrants from Kuwait |
| Minimum | $25,151 | $3,079 |
| Maximum | $52,125 | $112,212 |
| Range | $26,974 | $109,133 |
| Mean | $35,597 | $48,846 |
| Median | $35,991 | $48,319 |
| Interquartile 25% (IQ1) | $31,224 | $40,771 |
| Interquartile 75% (IQ3) | $39,973 | $55,536 |
| Interquartile Range (IQR) | $8,749 | $14,765 |
| Standard Deviation (Sample) | $5,768 | $21,440 |
| Standard Deviation (Population) | $5,729 | $21,183 |
Similar Demographics by Median Earnings
Demographics Similar to Hondurans by Median Earnings
In terms of median earnings, the demographic groups most similar to Hondurans are Yaqui ($40,647, a difference of 0.020%), Cuban ($40,619, a difference of 0.050%), Chickasaw ($40,672, a difference of 0.080%), Immigrants from Haiti ($40,550, a difference of 0.22%), and Immigrants from Guatemala ($40,851, a difference of 0.52%).
| Demographics | Rating | Rank | Median Earnings |
| Ute | 0.1 /100 | #300 | Tragic $41,051 |
| Immigrants | Latin America | 0.1 /100 | #301 | Tragic $41,049 |
| Shoshone | 0.0 /100 | #302 | Tragic $40,932 |
| Haitians | 0.0 /100 | #303 | Tragic $40,918 |
| Immigrants | Guatemala | 0.0 /100 | #304 | Tragic $40,851 |
| Chickasaw | 0.0 /100 | #305 | Tragic $40,672 |
| Yaqui | 0.0 /100 | #306 | Tragic $40,647 |
| Hondurans | 0.0 /100 | #307 | Tragic $40,638 |
| Cubans | 0.0 /100 | #308 | Tragic $40,619 |
| Immigrants | Haiti | 0.0 /100 | #309 | Tragic $40,550 |
| Apache | 0.0 /100 | #310 | Tragic $40,388 |
| Hispanics or Latinos | 0.0 /100 | #311 | Tragic $40,288 |
| Chippewa | 0.0 /100 | #312 | Tragic $40,287 |
| Choctaw | 0.0 /100 | #313 | Tragic $40,270 |
| Cheyenne | 0.0 /100 | #314 | Tragic $40,233 |
Demographics Similar to Immigrants from Kuwait by Median Earnings
In terms of median earnings, the demographic groups most similar to Immigrants from Kuwait are Northern European ($48,887, a difference of 0.050%), Moroccan ($48,838, a difference of 0.050%), Chinese ($48,836, a difference of 0.050%), Immigrants from Zimbabwe ($48,913, a difference of 0.11%), and Immigrants from Ethiopia ($48,924, a difference of 0.13%).
| Demographics | Rating | Rank | Median Earnings |
| Immigrants | Albania | 98.4 /100 | #106 | Exceptional $49,377 |
| Immigrants | Morocco | 98.4 /100 | #107 | Exceptional $49,368 |
| Palestinians | 98.0 /100 | #108 | Exceptional $49,209 |
| Syrians | 97.1 /100 | #109 | Exceptional $48,934 |
| Immigrants | Ethiopia | 97.1 /100 | #110 | Exceptional $48,924 |
| Immigrants | Zimbabwe | 97.0 /100 | #111 | Exceptional $48,913 |
| Northern Europeans | 96.9 /100 | #112 | Exceptional $48,887 |
| Immigrants | Kuwait | 96.8 /100 | #113 | Exceptional $48,861 |
| Moroccans | 96.7 /100 | #114 | Exceptional $48,838 |
| Chinese | 96.7 /100 | #115 | Exceptional $48,836 |
| Koreans | 96.2 /100 | #116 | Exceptional $48,727 |
| Serbians | 95.9 /100 | #117 | Exceptional $48,677 |
| Immigrants | Jordan | 95.9 /100 | #118 | Exceptional $48,673 |
| Poles | 95.8 /100 | #119 | Exceptional $48,659 |
| Carpatho Rusyns | 95.5 /100 | #120 | Exceptional $48,617 |