Costa Rican vs Immigrants from Kuwait Median Earnings
COMPARE
Costa Rican
Immigrants from Kuwait
Median Earnings
Median Earnings Comparison
Costa Ricans
Immigrants from Kuwait
$46,645
MEDIAN EARNINGS
57.4/ 100
METRIC RATING
167th/ 347
METRIC RANK
$48,861
MEDIAN EARNINGS
96.8/ 100
METRIC RATING
113th/ 347
METRIC RANK
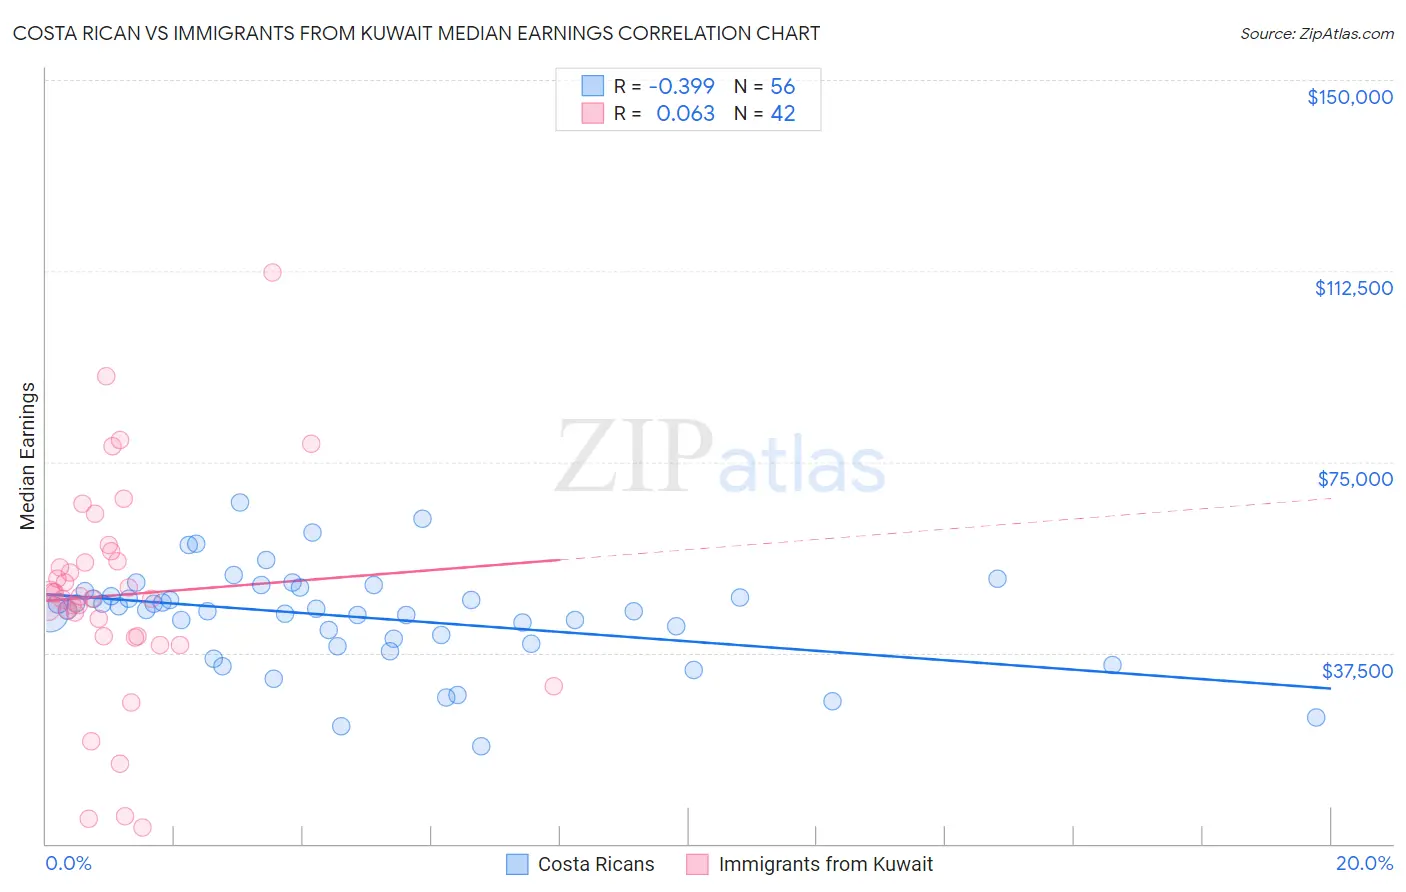
Costa Rican vs Immigrants from Kuwait Median Earnings Correlation Chart
The statistical analysis conducted on geographies consisting of 253,579,984 people shows a mild negative correlation between the proportion of Costa Ricans and median earnings in the United States with a correlation coefficient (R) of -0.399 and weighted average of $46,645. Similarly, the statistical analysis conducted on geographies consisting of 136,904,336 people shows a slight positive correlation between the proportion of Immigrants from Kuwait and median earnings in the United States with a correlation coefficient (R) of 0.063 and weighted average of $48,861, a difference of 4.8%.
Median Earnings Correlation Summary
| Measurement | Costa Rican | Immigrants from Kuwait |
| Minimum | $19,205 | $3,079 |
| Maximum | $67,102 | $112,212 |
| Range | $47,897 | $109,133 |
| Mean | $44,542 | $48,846 |
| Median | $45,923 | $48,319 |
| Interquartile 25% (IQ1) | $39,792 | $40,771 |
| Interquartile 75% (IQ3) | $49,211 | $55,536 |
| Interquartile Range (IQR) | $9,420 | $14,765 |
| Standard Deviation (Sample) | $9,601 | $21,440 |
| Standard Deviation (Population) | $9,515 | $21,183 |
Similar Demographics by Median Earnings
Demographics Similar to Costa Ricans by Median Earnings
In terms of median earnings, the demographic groups most similar to Costa Ricans are Czechoslovakian ($46,658, a difference of 0.030%), Immigrants from Africa ($46,564, a difference of 0.17%), Immigrants from South America ($46,548, a difference of 0.21%), South American ($46,804, a difference of 0.34%), and Immigrants ($46,478, a difference of 0.36%).
| Demographics | Rating | Rank | Median Earnings |
| Alsatians | 69.6 /100 | #160 | Good $47,023 |
| Immigrants | Eastern Africa | 68.0 /100 | #161 | Good $46,969 |
| South American Indians | 67.4 /100 | #162 | Good $46,952 |
| Icelanders | 66.3 /100 | #163 | Good $46,916 |
| Norwegians | 64.7 /100 | #164 | Good $46,865 |
| South Americans | 62.7 /100 | #165 | Good $46,804 |
| Czechoslovakians | 57.8 /100 | #166 | Average $46,658 |
| Costa Ricans | 57.4 /100 | #167 | Average $46,645 |
| Immigrants | Africa | 54.6 /100 | #168 | Average $46,564 |
| Immigrants | South America | 54.0 /100 | #169 | Average $46,548 |
| Immigrants | Immigrants | 51.6 /100 | #170 | Average $46,478 |
| Scottish | 51.1 /100 | #171 | Average $46,463 |
| Kenyans | 51.0 /100 | #172 | Average $46,462 |
| Ghanaians | 50.3 /100 | #173 | Average $46,440 |
| Scandinavians | 50.0 /100 | #174 | Average $46,433 |
Demographics Similar to Immigrants from Kuwait by Median Earnings
In terms of median earnings, the demographic groups most similar to Immigrants from Kuwait are Northern European ($48,887, a difference of 0.050%), Moroccan ($48,838, a difference of 0.050%), Chinese ($48,836, a difference of 0.050%), Immigrants from Zimbabwe ($48,913, a difference of 0.11%), and Immigrants from Ethiopia ($48,924, a difference of 0.13%).
| Demographics | Rating | Rank | Median Earnings |
| Immigrants | Albania | 98.4 /100 | #106 | Exceptional $49,377 |
| Immigrants | Morocco | 98.4 /100 | #107 | Exceptional $49,368 |
| Palestinians | 98.0 /100 | #108 | Exceptional $49,209 |
| Syrians | 97.1 /100 | #109 | Exceptional $48,934 |
| Immigrants | Ethiopia | 97.1 /100 | #110 | Exceptional $48,924 |
| Immigrants | Zimbabwe | 97.0 /100 | #111 | Exceptional $48,913 |
| Northern Europeans | 96.9 /100 | #112 | Exceptional $48,887 |
| Immigrants | Kuwait | 96.8 /100 | #113 | Exceptional $48,861 |
| Moroccans | 96.7 /100 | #114 | Exceptional $48,838 |
| Chinese | 96.7 /100 | #115 | Exceptional $48,836 |
| Koreans | 96.2 /100 | #116 | Exceptional $48,727 |
| Serbians | 95.9 /100 | #117 | Exceptional $48,677 |
| Immigrants | Jordan | 95.9 /100 | #118 | Exceptional $48,673 |
| Poles | 95.8 /100 | #119 | Exceptional $48,659 |
| Carpatho Rusyns | 95.5 /100 | #120 | Exceptional $48,617 |