Northern European vs Swedish Wage/Income Gap
COMPARE
Northern European
Swedish
Wage/Income Gap
Wage/Income Gap Comparison
Northern Europeans
Swedes
28.3%
WAGE/INCOME GAP
0.3/ 100
METRIC RATING
296th/ 347
METRIC RANK
29.4%
WAGE/INCOME GAP
0.0/ 100
METRIC RATING
334th/ 347
METRIC RANK
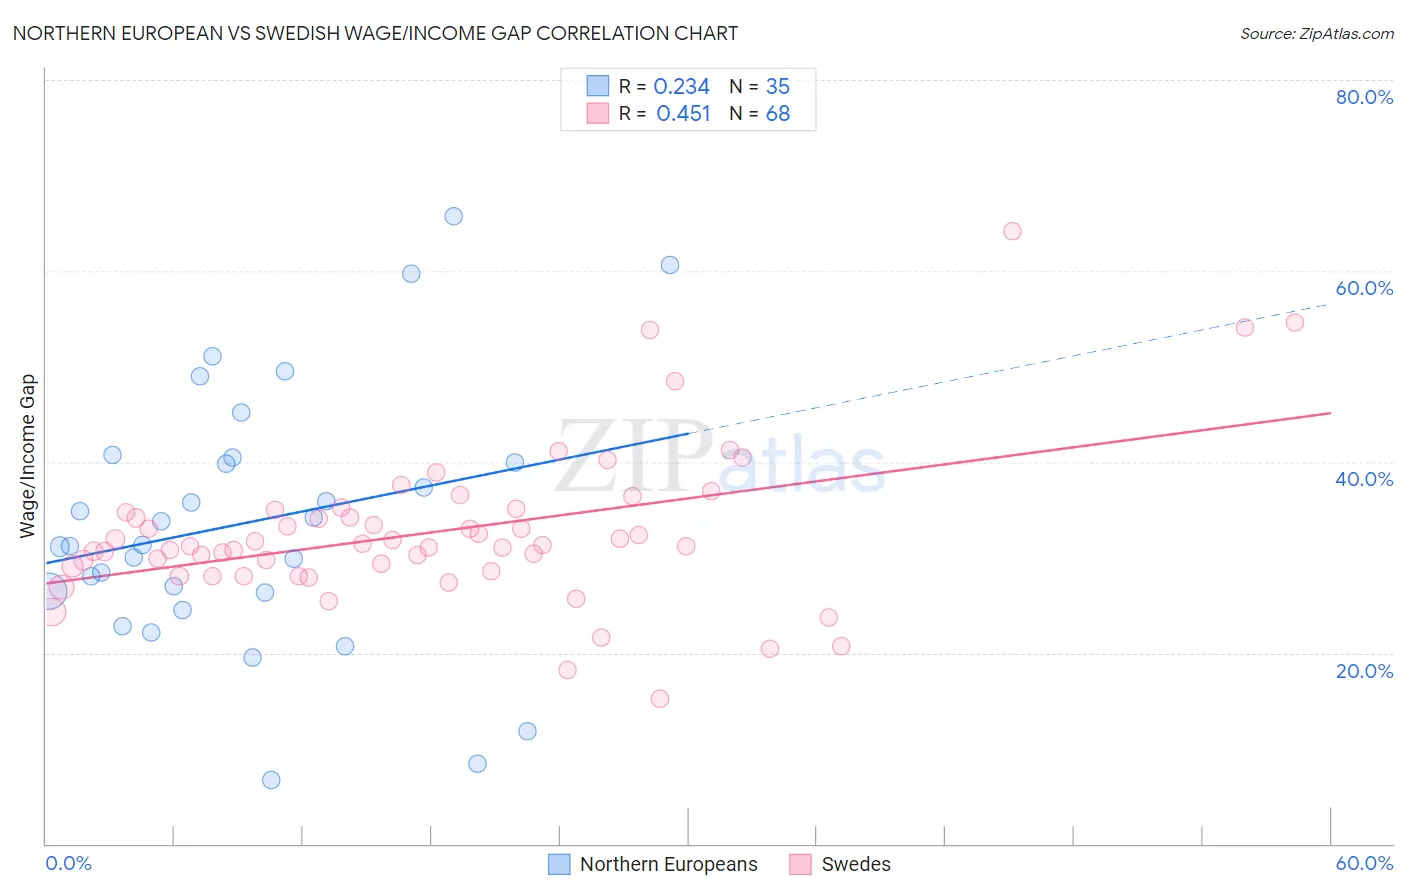
Northern European vs Swedish Wage/Income Gap Correlation Chart
The statistical analysis conducted on geographies consisting of 405,582,717 people shows a weak positive correlation between the proportion of Northern Europeans and wage/income gap percentage in the United States with a correlation coefficient (R) of 0.234 and weighted average of 28.3%. Similarly, the statistical analysis conducted on geographies consisting of 537,447,925 people shows a moderate positive correlation between the proportion of Swedes and wage/income gap percentage in the United States with a correlation coefficient (R) of 0.451 and weighted average of 29.4%, a difference of 4.0%.
Wage/Income Gap Correlation Summary
| Measurement | Northern European | Swedish |
| Minimum | 6.7% | 15.2% |
| Maximum | 65.7% | 64.2% |
| Range | 59.0% | 49.0% |
| Mean | 33.7% | 32.7% |
| Median | 31.3% | 31.2% |
| Interquartile 25% (IQ1) | 26.3% | 28.8% |
| Interquartile 75% (IQ3) | 40.5% | 34.8% |
| Interquartile Range (IQR) | 14.2% | 6.1% |
| Standard Deviation (Sample) | 13.7% | 8.2% |
| Standard Deviation (Population) | 13.5% | 8.1% |
Similar Demographics by Wage/Income Gap
Demographics Similar to Northern Europeans by Wage/Income Gap
In terms of wage/income gap, the demographic groups most similar to Northern Europeans are Slovene (28.3%, a difference of 0.0%), Greek (28.2%, a difference of 0.13%), Immigrants from Israel (28.2%, a difference of 0.16%), Immigrants from Australia (28.2%, a difference of 0.27%), and Czechoslovakian (28.2%, a difference of 0.32%).
| Demographics | Rating | Rank | Wage/Income Gap |
| Canadians | 0.3 /100 | #289 | Tragic 28.1% |
| Australians | 0.3 /100 | #290 | Tragic 28.2% |
| Czechoslovakians | 0.3 /100 | #291 | Tragic 28.2% |
| Immigrants | Australia | 0.3 /100 | #292 | Tragic 28.2% |
| Immigrants | Israel | 0.3 /100 | #293 | Tragic 28.2% |
| Greeks | 0.3 /100 | #294 | Tragic 28.2% |
| Slovenes | 0.3 /100 | #295 | Tragic 28.3% |
| Northern Europeans | 0.3 /100 | #296 | Tragic 28.3% |
| Immigrants | North America | 0.2 /100 | #297 | Tragic 28.4% |
| Austrians | 0.2 /100 | #298 | Tragic 28.4% |
| Immigrants | North Macedonia | 0.2 /100 | #299 | Tragic 28.4% |
| Immigrants | Northern Europe | 0.2 /100 | #300 | Tragic 28.5% |
| Immigrants | Canada | 0.2 /100 | #301 | Tragic 28.5% |
| Scotch-Irish | 0.2 /100 | #302 | Tragic 28.5% |
| Irish | 0.2 /100 | #303 | Tragic 28.5% |
Demographics Similar to Swedes by Wage/Income Gap
In terms of wage/income gap, the demographic groups most similar to Swedes are Immigrants from Taiwan (29.5%, a difference of 0.13%), European (29.4%, a difference of 0.14%), English (29.5%, a difference of 0.14%), Immigrants from South Central Asia (29.3%, a difference of 0.34%), and Dutch (29.6%, a difference of 0.72%).
| Demographics | Rating | Rank | Wage/Income Gap |
| Immigrants | Iran | 0.0 /100 | #327 | Tragic 29.1% |
| Scandinavians | 0.0 /100 | #328 | Tragic 29.1% |
| Scottish | 0.0 /100 | #329 | Tragic 29.1% |
| Germans | 0.0 /100 | #330 | Tragic 29.2% |
| Czechs | 0.0 /100 | #331 | Tragic 29.2% |
| Immigrants | South Central Asia | 0.0 /100 | #332 | Tragic 29.3% |
| Europeans | 0.0 /100 | #333 | Tragic 29.4% |
| Swedes | 0.0 /100 | #334 | Tragic 29.4% |
| Immigrants | Taiwan | 0.0 /100 | #335 | Tragic 29.5% |
| English | 0.0 /100 | #336 | Tragic 29.5% |
| Dutch | 0.0 /100 | #337 | Tragic 29.6% |
| Filipinos | 0.0 /100 | #338 | Tragic 29.7% |
| Iranians | 0.0 /100 | #339 | Tragic 29.7% |
| Swiss | 0.0 /100 | #340 | Tragic 30.0% |
| Thais | 0.0 /100 | #341 | Tragic 30.5% |