Tongan vs Swedish Wage/Income Gap
COMPARE
Tongan
Swedish
Wage/Income Gap
Wage/Income Gap Comparison
Tongans
Swedes
27.5%
WAGE/INCOME GAP
1.7/ 100
METRIC RATING
260th/ 347
METRIC RANK
29.4%
WAGE/INCOME GAP
0.0/ 100
METRIC RATING
334th/ 347
METRIC RANK
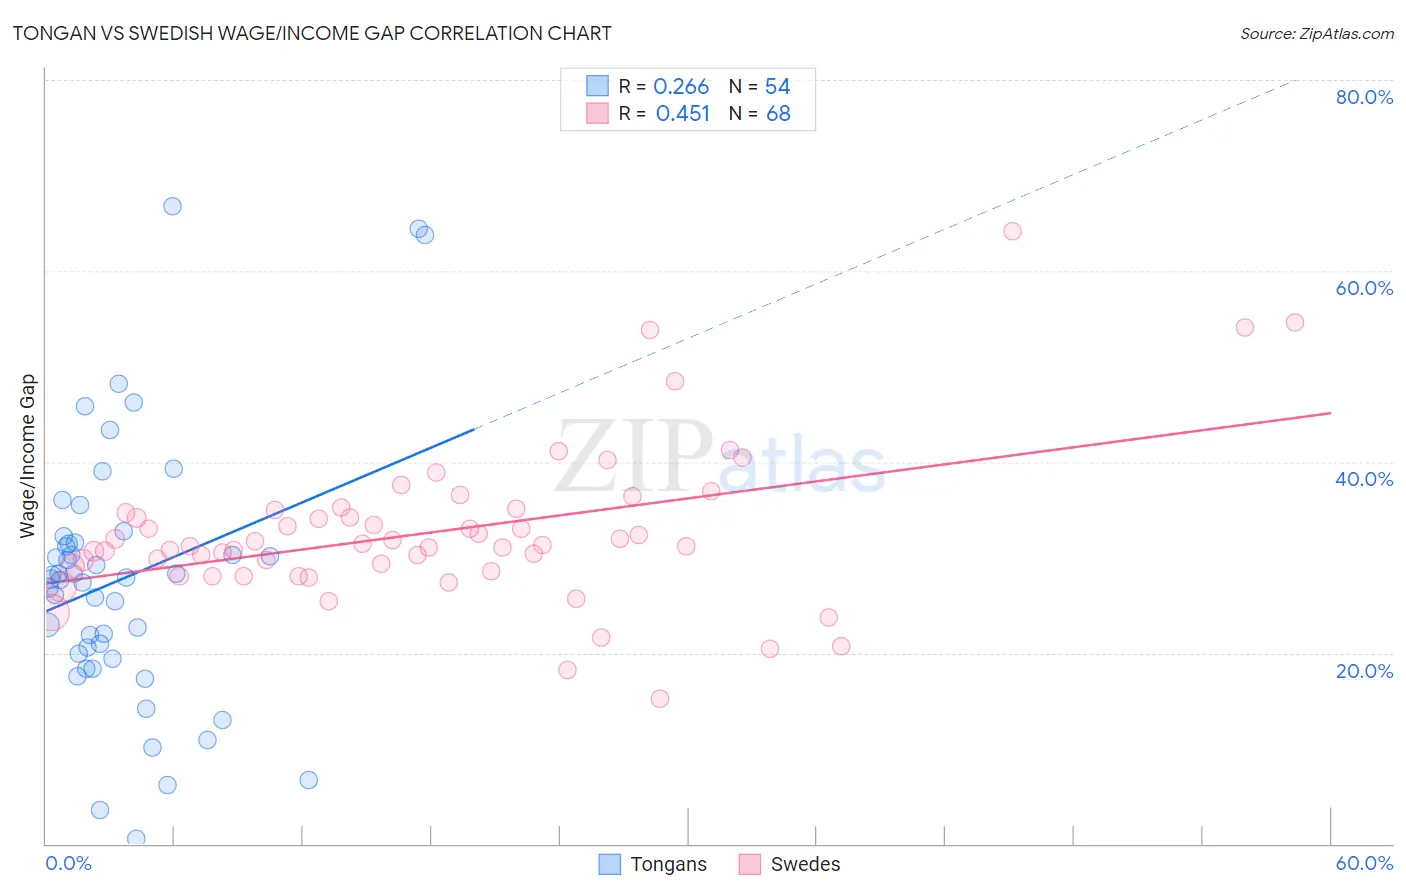
Tongan vs Swedish Wage/Income Gap Correlation Chart
The statistical analysis conducted on geographies consisting of 102,896,342 people shows a weak positive correlation between the proportion of Tongans and wage/income gap percentage in the United States with a correlation coefficient (R) of 0.266 and weighted average of 27.5%. Similarly, the statistical analysis conducted on geographies consisting of 537,447,925 people shows a moderate positive correlation between the proportion of Swedes and wage/income gap percentage in the United States with a correlation coefficient (R) of 0.451 and weighted average of 29.4%, a difference of 7.1%.
Wage/Income Gap Correlation Summary
| Measurement | Tongan | Swedish |
| Minimum | 0.48% | 15.2% |
| Maximum | 66.8% | 64.2% |
| Range | 66.3% | 49.0% |
| Mean | 27.8% | 32.7% |
| Median | 27.8% | 31.2% |
| Interquartile 25% (IQ1) | 20.0% | 28.8% |
| Interquartile 75% (IQ3) | 31.6% | 34.8% |
| Interquartile Range (IQR) | 11.6% | 6.1% |
| Standard Deviation (Sample) | 13.7% | 8.2% |
| Standard Deviation (Population) | 13.6% | 8.1% |
Similar Demographics by Wage/Income Gap
Demographics Similar to Tongans by Wage/Income Gap
In terms of wage/income gap, the demographic groups most similar to Tongans are Icelander (27.5%, a difference of 0.020%), Slavic (27.4%, a difference of 0.090%), Luxembourger (27.4%, a difference of 0.13%), Cherokee (27.4%, a difference of 0.18%), and Immigrants from Germany (27.5%, a difference of 0.26%).
| Demographics | Rating | Rank | Wage/Income Gap |
| Portuguese | 2.2 /100 | #253 | Tragic 27.4% |
| Israelis | 2.1 /100 | #254 | Tragic 27.4% |
| Immigrants | France | 2.1 /100 | #255 | Tragic 27.4% |
| Cherokee | 1.9 /100 | #256 | Tragic 27.4% |
| Luxembourgers | 1.9 /100 | #257 | Tragic 27.4% |
| Slavs | 1.8 /100 | #258 | Tragic 27.4% |
| Icelanders | 1.8 /100 | #259 | Tragic 27.5% |
| Tongans | 1.7 /100 | #260 | Tragic 27.5% |
| Immigrants | Germany | 1.5 /100 | #261 | Tragic 27.5% |
| Immigrants | Lebanon | 1.5 /100 | #262 | Tragic 27.5% |
| Syrians | 1.4 /100 | #263 | Tragic 27.6% |
| Immigrants | Switzerland | 1.0 /100 | #264 | Tragic 27.7% |
| Serbians | 1.0 /100 | #265 | Tragic 27.7% |
| Hmong | 1.0 /100 | #266 | Tragic 27.7% |
| Turks | 1.0 /100 | #267 | Tragic 27.7% |
Demographics Similar to Swedes by Wage/Income Gap
In terms of wage/income gap, the demographic groups most similar to Swedes are Immigrants from Taiwan (29.5%, a difference of 0.13%), European (29.4%, a difference of 0.14%), English (29.5%, a difference of 0.14%), Immigrants from South Central Asia (29.3%, a difference of 0.34%), and Dutch (29.6%, a difference of 0.72%).
| Demographics | Rating | Rank | Wage/Income Gap |
| Immigrants | Iran | 0.0 /100 | #327 | Tragic 29.1% |
| Scandinavians | 0.0 /100 | #328 | Tragic 29.1% |
| Scottish | 0.0 /100 | #329 | Tragic 29.1% |
| Germans | 0.0 /100 | #330 | Tragic 29.2% |
| Czechs | 0.0 /100 | #331 | Tragic 29.2% |
| Immigrants | South Central Asia | 0.0 /100 | #332 | Tragic 29.3% |
| Europeans | 0.0 /100 | #333 | Tragic 29.4% |
| Swedes | 0.0 /100 | #334 | Tragic 29.4% |
| Immigrants | Taiwan | 0.0 /100 | #335 | Tragic 29.5% |
| English | 0.0 /100 | #336 | Tragic 29.5% |
| Dutch | 0.0 /100 | #337 | Tragic 29.6% |
| Filipinos | 0.0 /100 | #338 | Tragic 29.7% |
| Iranians | 0.0 /100 | #339 | Tragic 29.7% |
| Swiss | 0.0 /100 | #340 | Tragic 30.0% |
| Thais | 0.0 /100 | #341 | Tragic 30.5% |