Immigrants from Sudan vs Immigrants from Europe GED/Equivalency
COMPARE
Immigrants from Sudan
Immigrants from Europe
GED/Equivalency
GED/Equivalency Comparison
Immigrants from Sudan
Immigrants from Europe
85.5%
GED/EQUIVALENCY
34.2/ 100
METRIC RATING
183rd/ 347
METRIC RANK
87.5%
GED/EQUIVALENCY
98.1/ 100
METRIC RATING
86th/ 347
METRIC RANK
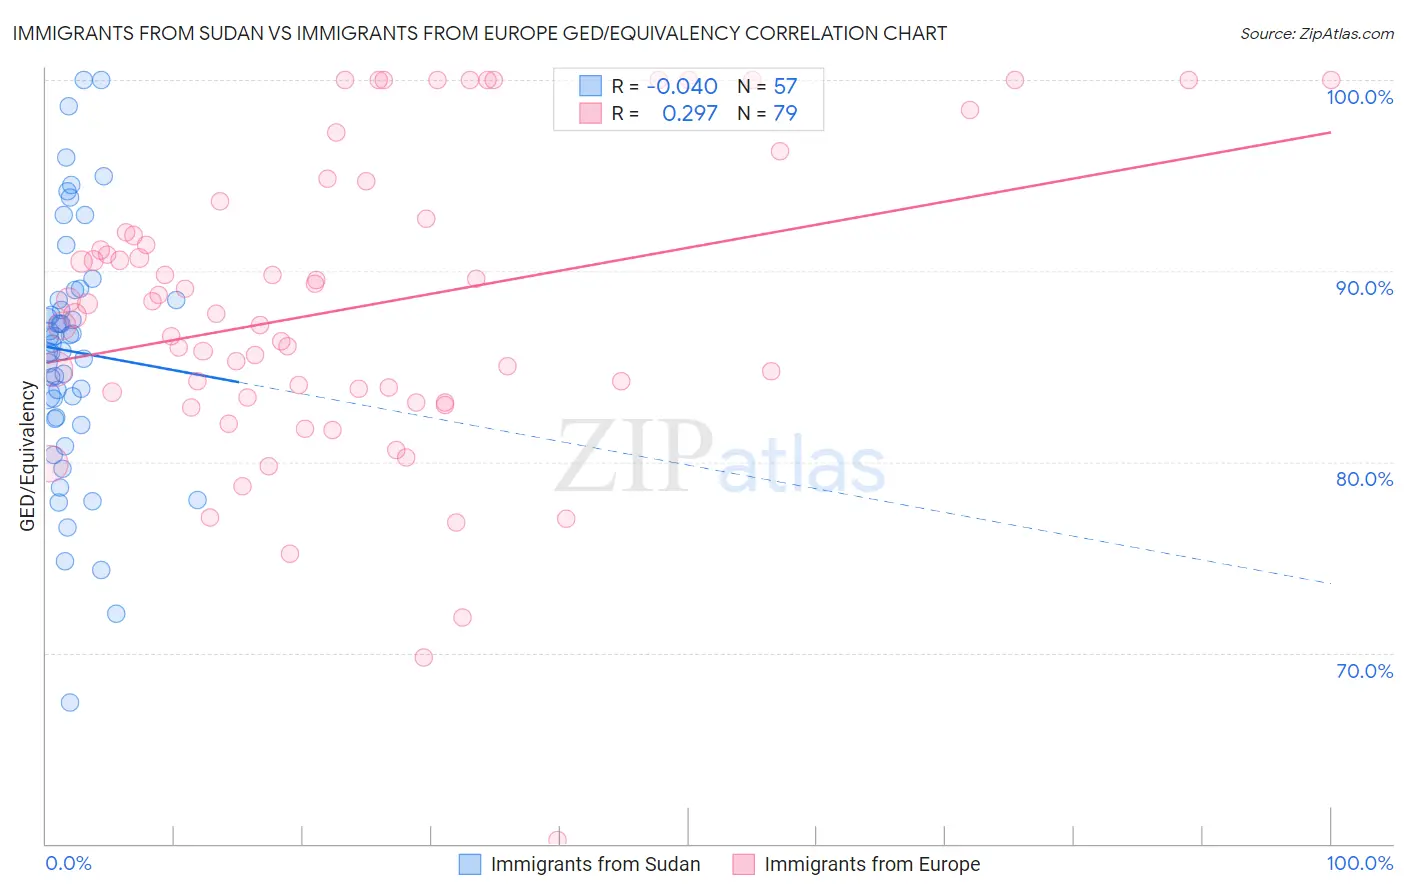
Immigrants from Sudan vs Immigrants from Europe GED/Equivalency Correlation Chart
The statistical analysis conducted on geographies consisting of 118,959,807 people shows no correlation between the proportion of Immigrants from Sudan and percentage of population with at least ged/equivalency education in the United States with a correlation coefficient (R) of -0.040 and weighted average of 85.5%. Similarly, the statistical analysis conducted on geographies consisting of 547,425,948 people shows a weak positive correlation between the proportion of Immigrants from Europe and percentage of population with at least ged/equivalency education in the United States with a correlation coefficient (R) of 0.297 and weighted average of 87.5%, a difference of 2.4%.
GED/Equivalency Correlation Summary
| Measurement | Immigrants from Sudan | Immigrants from Europe |
| Minimum | 67.4% | 60.2% |
| Maximum | 100.0% | 100.0% |
| Range | 32.6% | 39.8% |
| Mean | 85.8% | 88.1% |
| Median | 86.2% | 87.8% |
| Interquartile 25% (IQ1) | 82.3% | 83.4% |
| Interquartile 75% (IQ3) | 88.7% | 92.7% |
| Interquartile Range (IQR) | 6.4% | 9.3% |
| Standard Deviation (Sample) | 6.6% | 8.0% |
| Standard Deviation (Population) | 6.5% | 8.0% |
Similar Demographics by GED/Equivalency
Demographics Similar to Immigrants from Sudan by GED/Equivalency
In terms of ged/equivalency, the demographic groups most similar to Immigrants from Sudan are Immigrants from Oceania (85.5%, a difference of 0.010%), Sudanese (85.5%, a difference of 0.020%), Spanish (85.4%, a difference of 0.030%), Spaniard (85.4%, a difference of 0.050%), and Moroccan (85.5%, a difference of 0.080%).
| Demographics | Rating | Rank | GED/Equivalency |
| Immigrants | Eastern Africa | 47.7 /100 | #176 | Average 85.7% |
| Immigrants | Uganda | 45.2 /100 | #177 | Average 85.7% |
| Koreans | 41.2 /100 | #178 | Average 85.6% |
| Aleuts | 40.5 /100 | #179 | Average 85.6% |
| Immigrants | Southern Europe | 38.4 /100 | #180 | Fair 85.5% |
| Moroccans | 37.7 /100 | #181 | Fair 85.5% |
| Sudanese | 35.2 /100 | #182 | Fair 85.5% |
| Immigrants | Sudan | 34.2 /100 | #183 | Fair 85.5% |
| Immigrants | Oceania | 33.6 /100 | #184 | Fair 85.5% |
| Spanish | 32.8 /100 | #185 | Fair 85.4% |
| Spaniards | 31.9 /100 | #186 | Fair 85.4% |
| Immigrants | Afghanistan | 29.8 /100 | #187 | Fair 85.4% |
| Immigrants | Sierra Leone | 29.0 /100 | #188 | Fair 85.4% |
| Guamanians/Chamorros | 28.4 /100 | #189 | Fair 85.3% |
| Alaskan Athabascans | 27.5 /100 | #190 | Fair 85.3% |
Demographics Similar to Immigrants from Europe by GED/Equivalency
In terms of ged/equivalency, the demographic groups most similar to Immigrants from Europe are Native Hawaiian (87.5%, a difference of 0.0%), Immigrants from Romania (87.5%, a difference of 0.010%), Dutch (87.5%, a difference of 0.010%), Immigrants from Norway (87.5%, a difference of 0.010%), and South African (87.5%, a difference of 0.050%).
| Demographics | Rating | Rank | GED/Equivalency |
| English | 98.6 /100 | #79 | Exceptional 87.6% |
| Immigrants | England | 98.5 /100 | #80 | Exceptional 87.6% |
| Immigrants | Sri Lanka | 98.3 /100 | #81 | Exceptional 87.5% |
| Romanians | 98.3 /100 | #82 | Exceptional 87.5% |
| South Africans | 98.3 /100 | #83 | Exceptional 87.5% |
| Immigrants | Romania | 98.1 /100 | #84 | Exceptional 87.5% |
| Dutch | 98.1 /100 | #85 | Exceptional 87.5% |
| Immigrants | Europe | 98.1 /100 | #86 | Exceptional 87.5% |
| Native Hawaiians | 98.1 /100 | #87 | Exceptional 87.5% |
| Immigrants | Norway | 98.1 /100 | #88 | Exceptional 87.5% |
| Hungarians | 97.9 /100 | #89 | Exceptional 87.4% |
| Welsh | 97.9 /100 | #90 | Exceptional 87.4% |
| Immigrants | Eastern Asia | 97.9 /100 | #91 | Exceptional 87.4% |
| Israelis | 97.8 /100 | #92 | Exceptional 87.4% |
| Immigrants | North Macedonia | 97.8 /100 | #93 | Exceptional 87.4% |