Serbian vs Canadian Wage/Income Gap
COMPARE
Serbian
Canadian
Wage/Income Gap
Wage/Income Gap Comparison
Serbians
Canadians
27.7%
WAGE/INCOME GAP
1.0/ 100
METRIC RATING
265th/ 347
METRIC RANK
28.1%
WAGE/INCOME GAP
0.3/ 100
METRIC RATING
289th/ 347
METRIC RANK
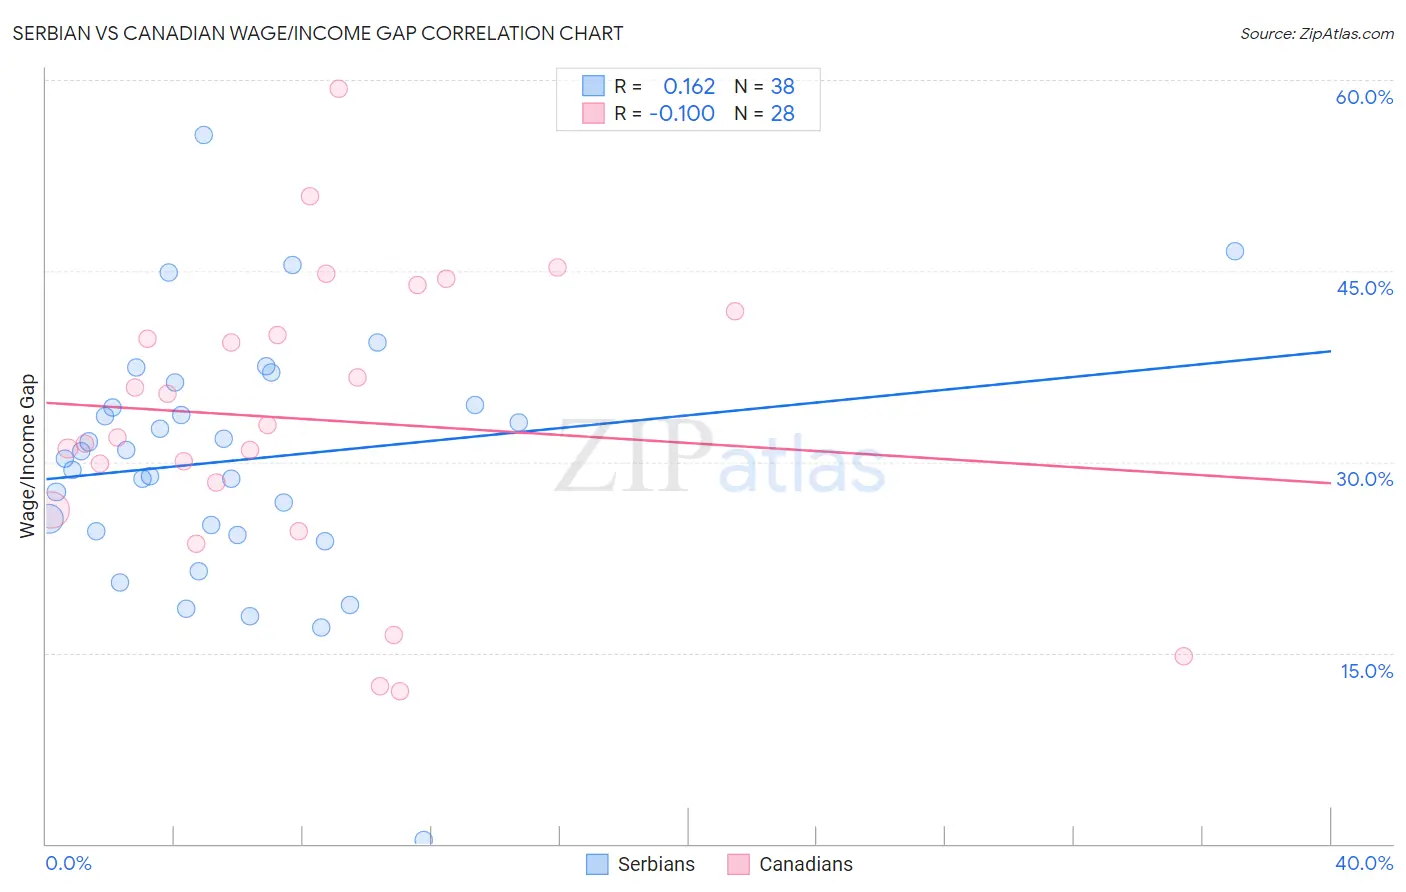
Serbian vs Canadian Wage/Income Gap Correlation Chart
The statistical analysis conducted on geographies consisting of 267,552,090 people shows a poor positive correlation between the proportion of Serbians and wage/income gap percentage in the United States with a correlation coefficient (R) of 0.162 and weighted average of 27.7%. Similarly, the statistical analysis conducted on geographies consisting of 437,073,113 people shows a slight negative correlation between the proportion of Canadians and wage/income gap percentage in the United States with a correlation coefficient (R) of -0.100 and weighted average of 28.1%, a difference of 1.7%.
Wage/Income Gap Correlation Summary
| Measurement | Serbian | Canadian |
| Minimum | 0.33% | 12.0% |
| Maximum | 55.6% | 59.3% |
| Range | 55.3% | 47.3% |
| Mean | 30.1% | 33.3% |
| Median | 30.5% | 32.4% |
| Interquartile 25% (IQ1) | 24.6% | 27.3% |
| Interquartile 75% (IQ3) | 34.5% | 40.9% |
| Interquartile Range (IQR) | 9.9% | 13.6% |
| Standard Deviation (Sample) | 9.8% | 11.4% |
| Standard Deviation (Population) | 9.7% | 11.2% |
Similar Demographics by Wage/Income Gap
Demographics Similar to Serbians by Wage/Income Gap
In terms of wage/income gap, the demographic groups most similar to Serbians are Immigrants from Switzerland (27.7%, a difference of 0.0%), Hmong (27.7%, a difference of 0.0%), Turkish (27.7%, a difference of 0.020%), New Zealander (27.7%, a difference of 0.10%), and Potawatomi (27.7%, a difference of 0.11%).
| Demographics | Rating | Rank | Wage/Income Gap |
| Slavs | 1.8 /100 | #258 | Tragic 27.4% |
| Icelanders | 1.8 /100 | #259 | Tragic 27.5% |
| Tongans | 1.7 /100 | #260 | Tragic 27.5% |
| Immigrants | Germany | 1.5 /100 | #261 | Tragic 27.5% |
| Immigrants | Lebanon | 1.5 /100 | #262 | Tragic 27.5% |
| Syrians | 1.4 /100 | #263 | Tragic 27.6% |
| Immigrants | Switzerland | 1.0 /100 | #264 | Tragic 27.7% |
| Serbians | 1.0 /100 | #265 | Tragic 27.7% |
| Hmong | 1.0 /100 | #266 | Tragic 27.7% |
| Turks | 1.0 /100 | #267 | Tragic 27.7% |
| New Zealanders | 1.0 /100 | #268 | Tragic 27.7% |
| Potawatomi | 0.9 /100 | #269 | Tragic 27.7% |
| Immigrants | Western Europe | 0.9 /100 | #270 | Tragic 27.8% |
| Ute | 0.8 /100 | #271 | Tragic 27.8% |
| Immigrants | Korea | 0.8 /100 | #272 | Tragic 27.8% |
Demographics Similar to Canadians by Wage/Income Gap
In terms of wage/income gap, the demographic groups most similar to Canadians are Choctaw (28.1%, a difference of 0.030%), Okinawan (28.1%, a difference of 0.070%), Australian (28.2%, a difference of 0.090%), Immigrants from Austria (28.1%, a difference of 0.11%), and Italian (28.1%, a difference of 0.14%).
| Demographics | Rating | Rank | Wage/Income Gap |
| South Africans | 0.5 /100 | #282 | Tragic 28.0% |
| French Canadians | 0.4 /100 | #283 | Tragic 28.1% |
| Immigrants | Sweden | 0.4 /100 | #284 | Tragic 28.1% |
| Italians | 0.4 /100 | #285 | Tragic 28.1% |
| Immigrants | Austria | 0.4 /100 | #286 | Tragic 28.1% |
| Okinawans | 0.4 /100 | #287 | Tragic 28.1% |
| Choctaw | 0.4 /100 | #288 | Tragic 28.1% |
| Canadians | 0.3 /100 | #289 | Tragic 28.1% |
| Australians | 0.3 /100 | #290 | Tragic 28.2% |
| Czechoslovakians | 0.3 /100 | #291 | Tragic 28.2% |
| Immigrants | Australia | 0.3 /100 | #292 | Tragic 28.2% |
| Immigrants | Israel | 0.3 /100 | #293 | Tragic 28.2% |
| Greeks | 0.3 /100 | #294 | Tragic 28.2% |
| Slovenes | 0.3 /100 | #295 | Tragic 28.3% |
| Northern Europeans | 0.3 /100 | #296 | Tragic 28.3% |