Immigrants from Mexico vs Malaysian Median Earnings
COMPARE
Immigrants from Mexico
Malaysian
Median Earnings
Median Earnings Comparison
Immigrants from Mexico
Malaysians
$39,114
MEDIAN EARNINGS
0.0/ 100
METRIC RATING
331st/ 347
METRIC RANK
$43,844
MEDIAN EARNINGS
2.6/ 100
METRIC RATING
249th/ 347
METRIC RANK
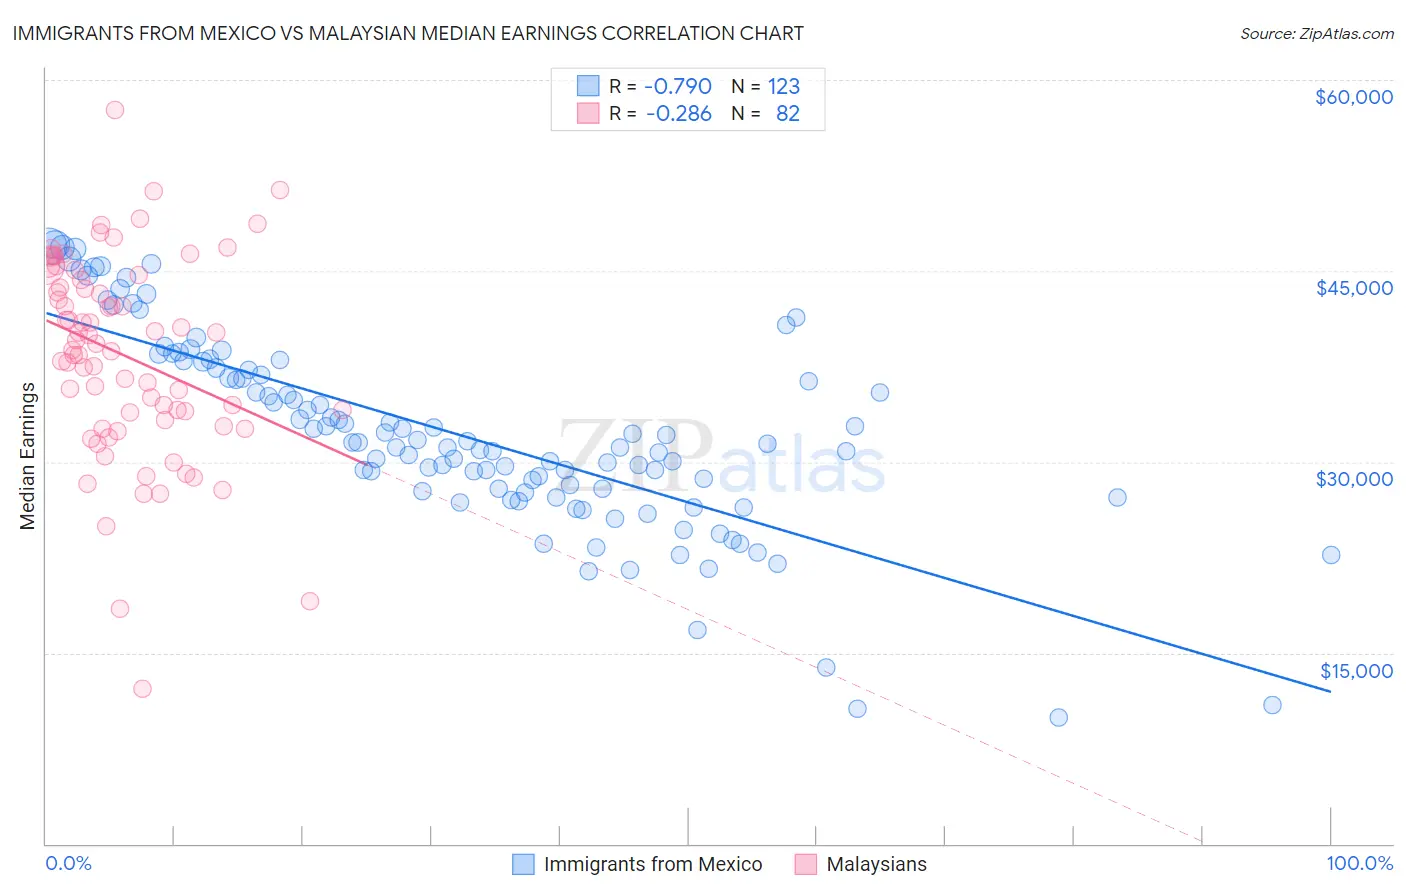
Immigrants from Mexico vs Malaysian Median Earnings Correlation Chart
The statistical analysis conducted on geographies consisting of 513,570,103 people shows a strong negative correlation between the proportion of Immigrants from Mexico and median earnings in the United States with a correlation coefficient (R) of -0.790 and weighted average of $39,114. Similarly, the statistical analysis conducted on geographies consisting of 226,109,286 people shows a weak negative correlation between the proportion of Malaysians and median earnings in the United States with a correlation coefficient (R) of -0.286 and weighted average of $43,844, a difference of 12.1%.
Median Earnings Correlation Summary
| Measurement | Immigrants from Mexico | Malaysian |
| Minimum | $9,917 | $12,196 |
| Maximum | $47,055 | $57,662 |
| Range | $37,138 | $45,466 |
| Mean | $32,176 | $38,334 |
| Median | $31,534 | $39,047 |
| Interquartile 25% (IQ1) | $27,679 | $33,295 |
| Interquartile 75% (IQ3) | $37,374 | $44,277 |
| Interquartile Range (IQR) | $9,695 | $10,982 |
| Standard Deviation (Sample) | $7,708 | $7,931 |
| Standard Deviation (Population) | $7,676 | $7,883 |
Similar Demographics by Median Earnings
Demographics Similar to Immigrants from Mexico by Median Earnings
In terms of median earnings, the demographic groups most similar to Immigrants from Mexico are Yakama ($39,107, a difference of 0.020%), Immigrants from Congo ($39,169, a difference of 0.14%), Kiowa ($39,232, a difference of 0.30%), Houma ($38,949, a difference of 0.42%), and Spanish American Indian ($38,907, a difference of 0.53%).
| Demographics | Rating | Rank | Median Earnings |
| Ottawa | 0.0 /100 | #324 | Tragic $39,721 |
| Creek | 0.0 /100 | #325 | Tragic $39,648 |
| Immigrants | Yemen | 0.0 /100 | #326 | Tragic $39,540 |
| Yuman | 0.0 /100 | #327 | Tragic $39,523 |
| Sioux | 0.0 /100 | #328 | Tragic $39,448 |
| Kiowa | 0.0 /100 | #329 | Tragic $39,232 |
| Immigrants | Congo | 0.0 /100 | #330 | Tragic $39,169 |
| Immigrants | Mexico | 0.0 /100 | #331 | Tragic $39,114 |
| Yakama | 0.0 /100 | #332 | Tragic $39,107 |
| Houma | 0.0 /100 | #333 | Tragic $38,949 |
| Spanish American Indians | 0.0 /100 | #334 | Tragic $38,907 |
| Natives/Alaskans | 0.0 /100 | #335 | Tragic $38,896 |
| Crow | 0.0 /100 | #336 | Tragic $38,707 |
| Immigrants | Cuba | 0.0 /100 | #337 | Tragic $38,426 |
| Pima | 0.0 /100 | #338 | Tragic $38,285 |
Demographics Similar to Malaysians by Median Earnings
In terms of median earnings, the demographic groups most similar to Malaysians are Nepalese ($43,860, a difference of 0.040%), Alaska Native ($43,750, a difference of 0.22%), Immigrants from Cabo Verde ($43,963, a difference of 0.27%), Immigrants from West Indies ($43,989, a difference of 0.33%), and Tsimshian ($43,695, a difference of 0.34%).
| Demographics | Rating | Rank | Median Earnings |
| Immigrants | Venezuela | 4.0 /100 | #242 | Tragic $44,163 |
| Sub-Saharan Africans | 3.7 /100 | #243 | Tragic $44,118 |
| Immigrants | Nonimmigrants | 3.7 /100 | #244 | Tragic $44,117 |
| Immigrants | Burma/Myanmar | 3.2 /100 | #245 | Tragic $43,998 |
| Immigrants | West Indies | 3.1 /100 | #246 | Tragic $43,989 |
| Immigrants | Cabo Verde | 3.0 /100 | #247 | Tragic $43,963 |
| Nepalese | 2.6 /100 | #248 | Tragic $43,860 |
| Malaysians | 2.6 /100 | #249 | Tragic $43,844 |
| Alaska Natives | 2.3 /100 | #250 | Tragic $43,750 |
| Tsimshian | 2.1 /100 | #251 | Tragic $43,695 |
| Hawaiians | 2.0 /100 | #252 | Tragic $43,673 |
| Somalis | 1.8 /100 | #253 | Tragic $43,567 |
| Liberians | 1.7 /100 | #254 | Tragic $43,536 |
| Immigrants | Middle Africa | 1.4 /100 | #255 | Tragic $43,416 |
| Alaskan Athabascans | 1.4 /100 | #256 | Tragic $43,393 |