Immigrants from Mexico vs Immigrants from Yemen Median Earnings
COMPARE
Immigrants from Mexico
Immigrants from Yemen
Median Earnings
Median Earnings Comparison
Immigrants from Mexico
Immigrants from Yemen
$39,114
MEDIAN EARNINGS
0.0/ 100
METRIC RATING
331st/ 347
METRIC RANK
$39,540
MEDIAN EARNINGS
0.0/ 100
METRIC RATING
326th/ 347
METRIC RANK
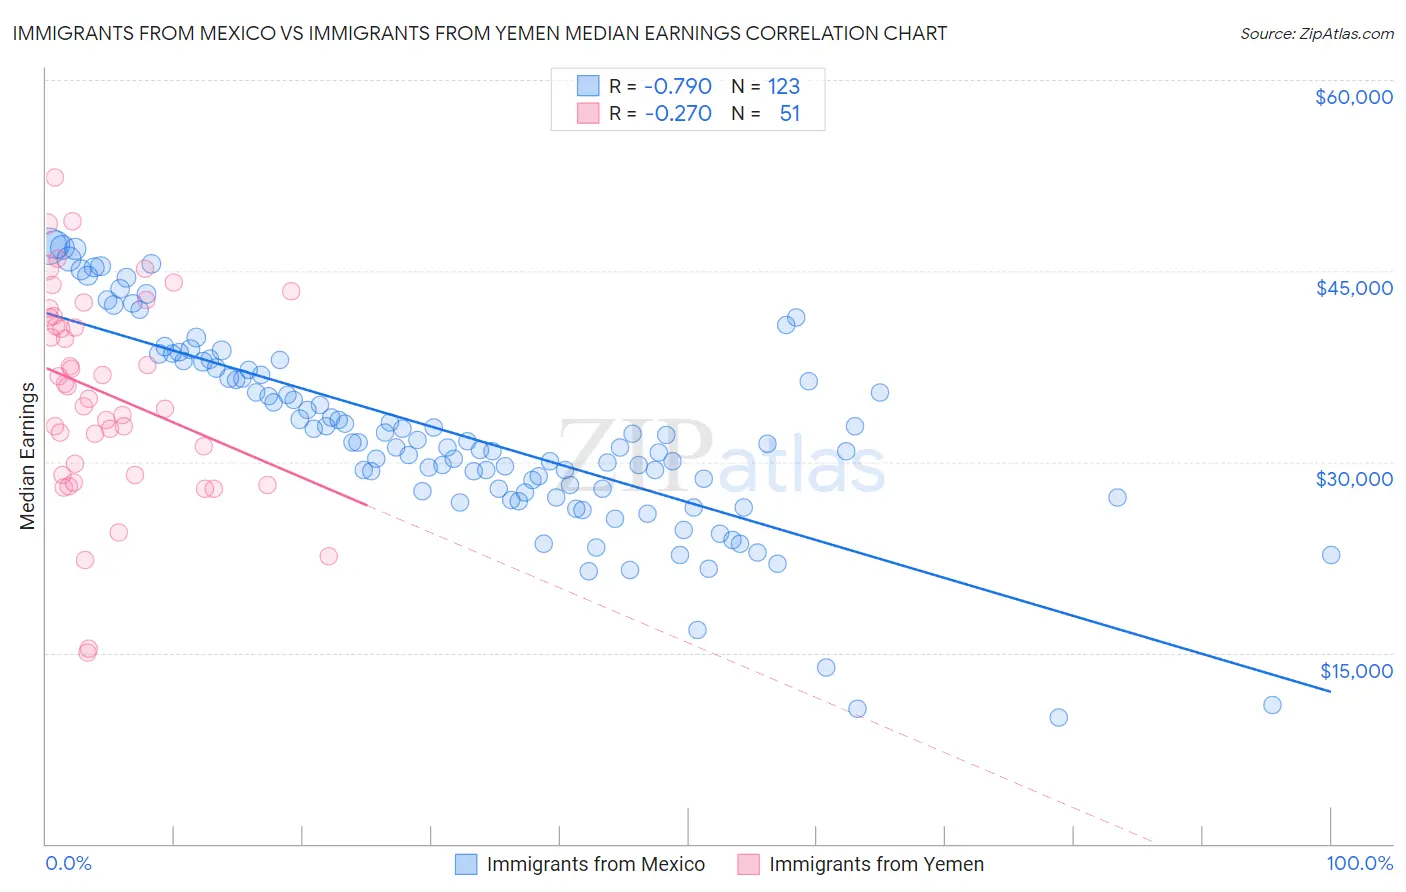
Immigrants from Mexico vs Immigrants from Yemen Median Earnings Correlation Chart
The statistical analysis conducted on geographies consisting of 513,570,103 people shows a strong negative correlation between the proportion of Immigrants from Mexico and median earnings in the United States with a correlation coefficient (R) of -0.790 and weighted average of $39,114. Similarly, the statistical analysis conducted on geographies consisting of 82,433,611 people shows a weak negative correlation between the proportion of Immigrants from Yemen and median earnings in the United States with a correlation coefficient (R) of -0.270 and weighted average of $39,540, a difference of 1.1%.
Median Earnings Correlation Summary
| Measurement | Immigrants from Mexico | Immigrants from Yemen |
| Minimum | $9,917 | $15,000 |
| Maximum | $47,055 | $52,299 |
| Range | $37,138 | $37,299 |
| Mean | $32,176 | $35,429 |
| Median | $31,534 | $35,934 |
| Interquartile 25% (IQ1) | $27,679 | $29,005 |
| Interquartile 75% (IQ3) | $37,374 | $41,449 |
| Interquartile Range (IQR) | $9,695 | $12,444 |
| Standard Deviation (Sample) | $7,708 | $8,118 |
| Standard Deviation (Population) | $7,676 | $8,038 |
Demographics Similar to Immigrants from Mexico and Immigrants from Yemen by Median Earnings
In terms of median earnings, the demographic groups most similar to Immigrants from Mexico are Yakama ($39,107, a difference of 0.020%), Immigrants from Congo ($39,169, a difference of 0.14%), Kiowa ($39,232, a difference of 0.30%), Houma ($38,949, a difference of 0.42%), and Spanish American Indian ($38,907, a difference of 0.53%). Similarly, the demographic groups most similar to Immigrants from Yemen are Yuman ($39,523, a difference of 0.040%), Sioux ($39,448, a difference of 0.23%), Creek ($39,648, a difference of 0.27%), Ottawa ($39,721, a difference of 0.46%), and Bahamian ($39,735, a difference of 0.49%).
| Demographics | Rating | Rank | Median Earnings |
| Dutch West Indians | 0.0 /100 | #318 | Tragic $40,107 |
| Blacks/African Americans | 0.0 /100 | #319 | Tragic $40,085 |
| Immigrants | Bahamas | 0.0 /100 | #320 | Tragic $39,861 |
| Mexicans | 0.0 /100 | #321 | Tragic $39,834 |
| Immigrants | Central America | 0.0 /100 | #322 | Tragic $39,762 |
| Bahamians | 0.0 /100 | #323 | Tragic $39,735 |
| Ottawa | 0.0 /100 | #324 | Tragic $39,721 |
| Creek | 0.0 /100 | #325 | Tragic $39,648 |
| Immigrants | Yemen | 0.0 /100 | #326 | Tragic $39,540 |
| Yuman | 0.0 /100 | #327 | Tragic $39,523 |
| Sioux | 0.0 /100 | #328 | Tragic $39,448 |
| Kiowa | 0.0 /100 | #329 | Tragic $39,232 |
| Immigrants | Congo | 0.0 /100 | #330 | Tragic $39,169 |
| Immigrants | Mexico | 0.0 /100 | #331 | Tragic $39,114 |
| Yakama | 0.0 /100 | #332 | Tragic $39,107 |
| Houma | 0.0 /100 | #333 | Tragic $38,949 |
| Spanish American Indians | 0.0 /100 | #334 | Tragic $38,907 |
| Natives/Alaskans | 0.0 /100 | #335 | Tragic $38,896 |
| Crow | 0.0 /100 | #336 | Tragic $38,707 |
| Immigrants | Cuba | 0.0 /100 | #337 | Tragic $38,426 |
| Pima | 0.0 /100 | #338 | Tragic $38,285 |