Immigrants from Mexico vs Puget Sound Salish Median Earnings
COMPARE
Immigrants from Mexico
Puget Sound Salish
Median Earnings
Median Earnings Comparison
Immigrants from Mexico
Puget Sound Salish
$39,114
MEDIAN EARNINGS
0.0/ 100
METRIC RATING
331st/ 347
METRIC RANK
$46,333
MEDIAN EARNINGS
46.5/ 100
METRIC RATING
180th/ 347
METRIC RANK
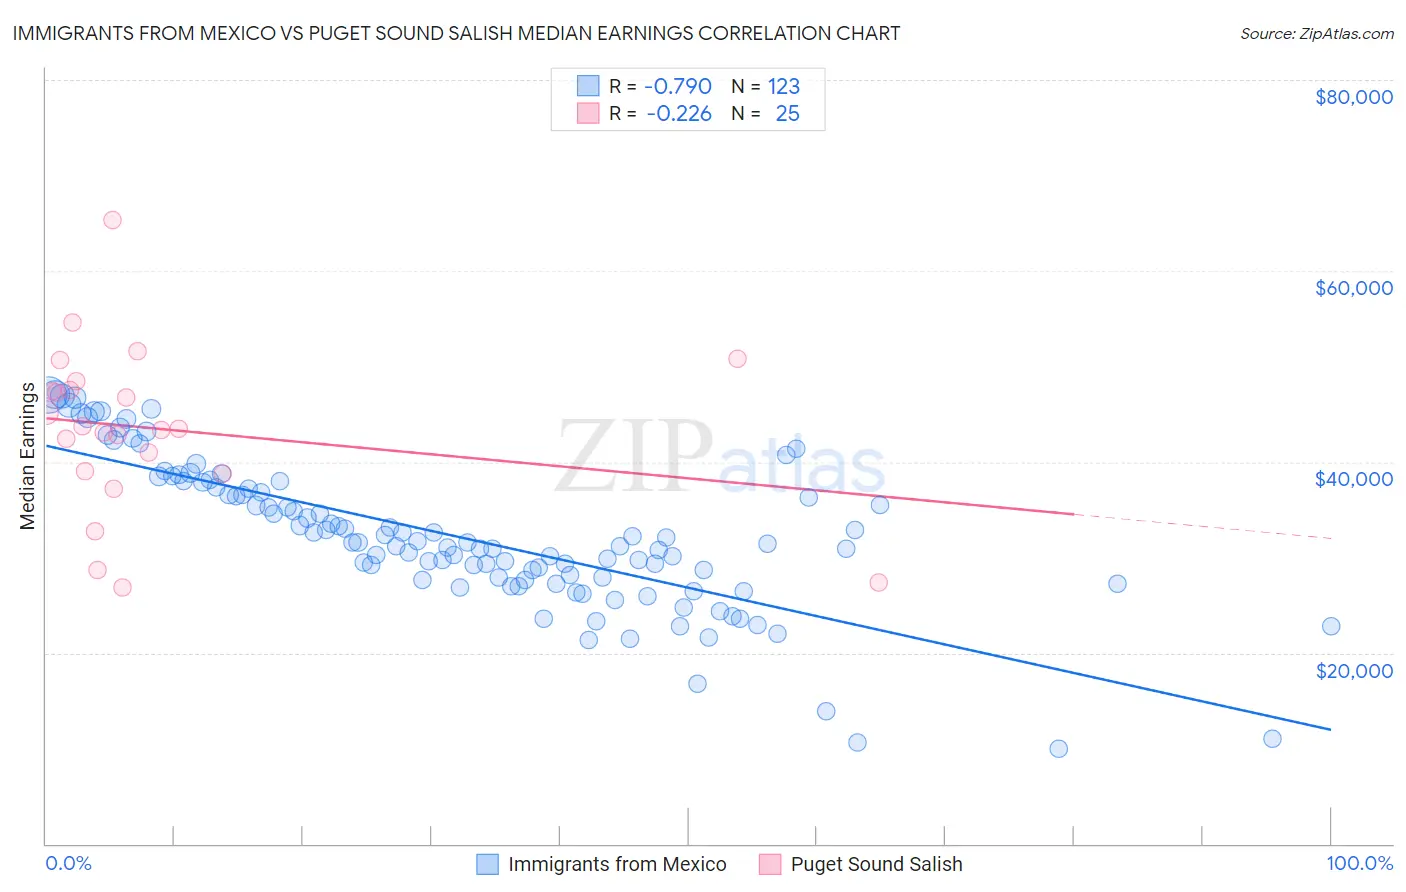
Immigrants from Mexico vs Puget Sound Salish Median Earnings Correlation Chart
The statistical analysis conducted on geographies consisting of 513,570,103 people shows a strong negative correlation between the proportion of Immigrants from Mexico and median earnings in the United States with a correlation coefficient (R) of -0.790 and weighted average of $39,114. Similarly, the statistical analysis conducted on geographies consisting of 46,155,746 people shows a weak negative correlation between the proportion of Puget Sound Salish and median earnings in the United States with a correlation coefficient (R) of -0.226 and weighted average of $46,333, a difference of 18.5%.
Median Earnings Correlation Summary
| Measurement | Immigrants from Mexico | Puget Sound Salish |
| Minimum | $9,917 | $26,875 |
| Maximum | $47,055 | $65,298 |
| Range | $37,138 | $38,423 |
| Mean | $32,176 | $43,450 |
| Median | $31,534 | $43,514 |
| Interquartile 25% (IQ1) | $27,679 | $38,912 |
| Interquartile 75% (IQ3) | $37,374 | $47,991 |
| Interquartile Range (IQR) | $9,695 | $9,079 |
| Standard Deviation (Sample) | $7,708 | $8,689 |
| Standard Deviation (Population) | $7,676 | $8,513 |
Similar Demographics by Median Earnings
Demographics Similar to Immigrants from Mexico by Median Earnings
In terms of median earnings, the demographic groups most similar to Immigrants from Mexico are Yakama ($39,107, a difference of 0.020%), Immigrants from Congo ($39,169, a difference of 0.14%), Kiowa ($39,232, a difference of 0.30%), Houma ($38,949, a difference of 0.42%), and Spanish American Indian ($38,907, a difference of 0.53%).
| Demographics | Rating | Rank | Median Earnings |
| Ottawa | 0.0 /100 | #324 | Tragic $39,721 |
| Creek | 0.0 /100 | #325 | Tragic $39,648 |
| Immigrants | Yemen | 0.0 /100 | #326 | Tragic $39,540 |
| Yuman | 0.0 /100 | #327 | Tragic $39,523 |
| Sioux | 0.0 /100 | #328 | Tragic $39,448 |
| Kiowa | 0.0 /100 | #329 | Tragic $39,232 |
| Immigrants | Congo | 0.0 /100 | #330 | Tragic $39,169 |
| Immigrants | Mexico | 0.0 /100 | #331 | Tragic $39,114 |
| Yakama | 0.0 /100 | #332 | Tragic $39,107 |
| Houma | 0.0 /100 | #333 | Tragic $38,949 |
| Spanish American Indians | 0.0 /100 | #334 | Tragic $38,907 |
| Natives/Alaskans | 0.0 /100 | #335 | Tragic $38,896 |
| Crow | 0.0 /100 | #336 | Tragic $38,707 |
| Immigrants | Cuba | 0.0 /100 | #337 | Tragic $38,426 |
| Pima | 0.0 /100 | #338 | Tragic $38,285 |
Demographics Similar to Puget Sound Salish by Median Earnings
In terms of median earnings, the demographic groups most similar to Puget Sound Salish are English ($46,334, a difference of 0.0%), Immigrants from Cameroon ($46,329, a difference of 0.010%), Colombian ($46,349, a difference of 0.040%), Swiss ($46,315, a difference of 0.040%), and French ($46,296, a difference of 0.080%).
| Demographics | Rating | Rank | Median Earnings |
| Ghanaians | 50.3 /100 | #173 | Average $46,440 |
| Scandinavians | 50.0 /100 | #174 | Average $46,433 |
| Basques | 48.8 /100 | #175 | Average $46,399 |
| Danes | 48.6 /100 | #176 | Average $46,392 |
| Belgians | 48.0 /100 | #177 | Average $46,375 |
| Colombians | 47.1 /100 | #178 | Average $46,349 |
| English | 46.5 /100 | #179 | Average $46,334 |
| Puget Sound Salish | 46.5 /100 | #180 | Average $46,333 |
| Immigrants | Cameroon | 46.4 /100 | #181 | Average $46,329 |
| Swiss | 45.9 /100 | #182 | Average $46,315 |
| French | 45.2 /100 | #183 | Average $46,296 |
| Immigrants | Kenya | 42.4 /100 | #184 | Average $46,214 |
| Uruguayans | 41.6 /100 | #185 | Average $46,190 |
| Vietnamese | 40.9 /100 | #186 | Average $46,172 |
| Iraqis | 39.9 /100 | #187 | Fair $46,140 |