Immigrants from Mexico vs Immigrants from Netherlands Median Earnings
COMPARE
Immigrants from Mexico
Immigrants from Netherlands
Median Earnings
Median Earnings Comparison
Immigrants from Mexico
Immigrants from Netherlands
$39,114
MEDIAN EARNINGS
0.0/ 100
METRIC RATING
331st/ 347
METRIC RANK
$50,818
MEDIAN EARNINGS
99.8/ 100
METRIC RATING
73rd/ 347
METRIC RANK
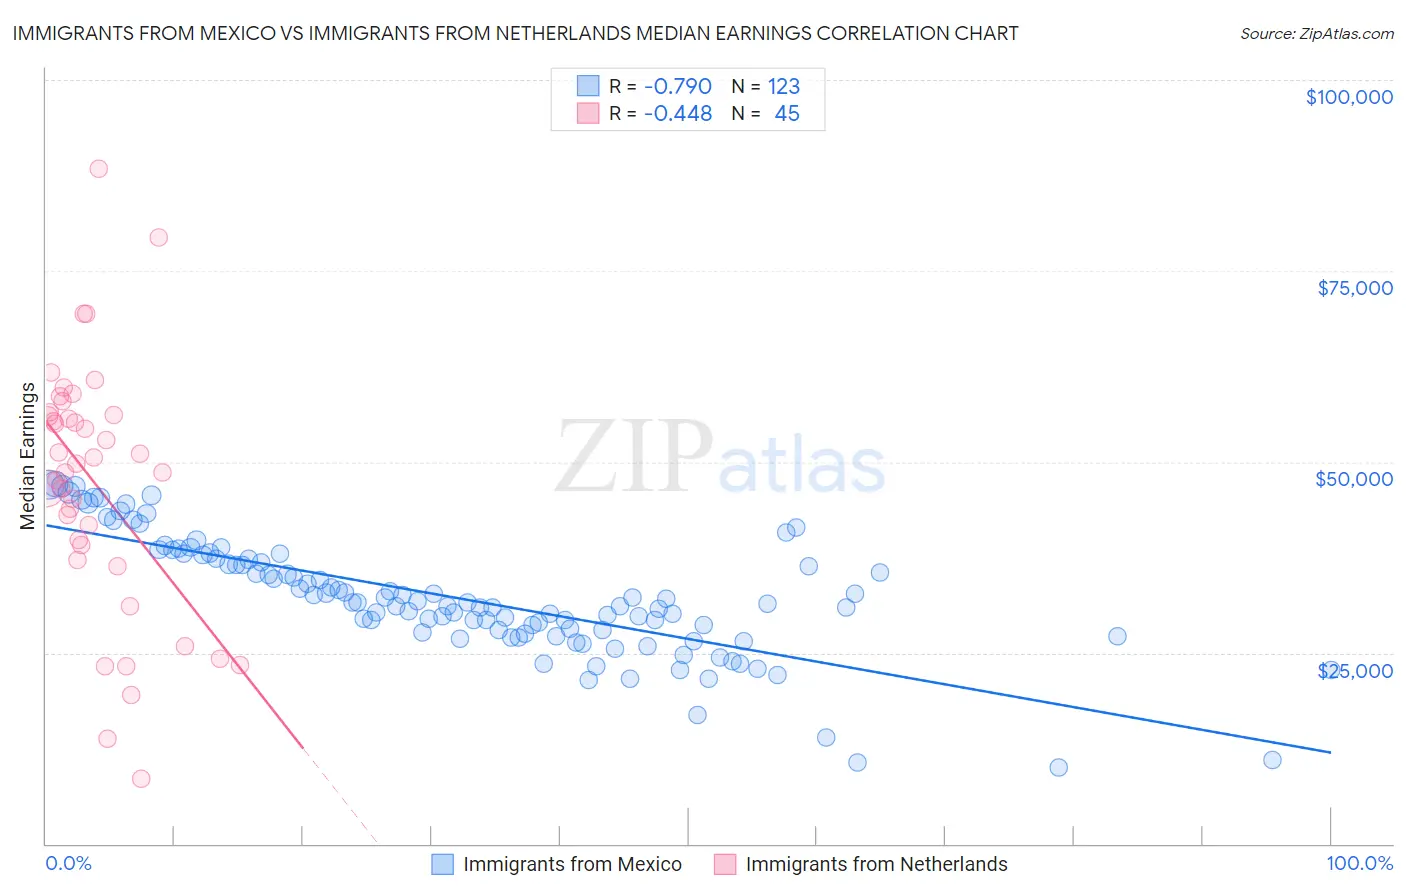
Immigrants from Mexico vs Immigrants from Netherlands Median Earnings Correlation Chart
The statistical analysis conducted on geographies consisting of 513,570,103 people shows a strong negative correlation between the proportion of Immigrants from Mexico and median earnings in the United States with a correlation coefficient (R) of -0.790 and weighted average of $39,114. Similarly, the statistical analysis conducted on geographies consisting of 237,873,103 people shows a moderate negative correlation between the proportion of Immigrants from Netherlands and median earnings in the United States with a correlation coefficient (R) of -0.448 and weighted average of $50,818, a difference of 29.9%.
Median Earnings Correlation Summary
| Measurement | Immigrants from Mexico | Immigrants from Netherlands |
| Minimum | $9,917 | $8,447 |
| Maximum | $47,055 | $88,336 |
| Range | $37,138 | $79,889 |
| Mean | $32,176 | $47,130 |
| Median | $31,534 | $49,796 |
| Interquartile 25% (IQ1) | $27,679 | $38,138 |
| Interquartile 75% (IQ3) | $37,374 | $56,269 |
| Interquartile Range (IQR) | $9,695 | $18,130 |
| Standard Deviation (Sample) | $7,708 | $16,545 |
| Standard Deviation (Population) | $7,676 | $16,360 |
Similar Demographics by Median Earnings
Demographics Similar to Immigrants from Mexico by Median Earnings
In terms of median earnings, the demographic groups most similar to Immigrants from Mexico are Yakama ($39,107, a difference of 0.020%), Immigrants from Congo ($39,169, a difference of 0.14%), Kiowa ($39,232, a difference of 0.30%), Houma ($38,949, a difference of 0.42%), and Spanish American Indian ($38,907, a difference of 0.53%).
| Demographics | Rating | Rank | Median Earnings |
| Ottawa | 0.0 /100 | #324 | Tragic $39,721 |
| Creek | 0.0 /100 | #325 | Tragic $39,648 |
| Immigrants | Yemen | 0.0 /100 | #326 | Tragic $39,540 |
| Yuman | 0.0 /100 | #327 | Tragic $39,523 |
| Sioux | 0.0 /100 | #328 | Tragic $39,448 |
| Kiowa | 0.0 /100 | #329 | Tragic $39,232 |
| Immigrants | Congo | 0.0 /100 | #330 | Tragic $39,169 |
| Immigrants | Mexico | 0.0 /100 | #331 | Tragic $39,114 |
| Yakama | 0.0 /100 | #332 | Tragic $39,107 |
| Houma | 0.0 /100 | #333 | Tragic $38,949 |
| Spanish American Indians | 0.0 /100 | #334 | Tragic $38,907 |
| Natives/Alaskans | 0.0 /100 | #335 | Tragic $38,896 |
| Crow | 0.0 /100 | #336 | Tragic $38,707 |
| Immigrants | Cuba | 0.0 /100 | #337 | Tragic $38,426 |
| Pima | 0.0 /100 | #338 | Tragic $38,285 |
Demographics Similar to Immigrants from Netherlands by Median Earnings
In terms of median earnings, the demographic groups most similar to Immigrants from Netherlands are South African ($50,752, a difference of 0.13%), Immigrants from Scotland ($50,741, a difference of 0.15%), Immigrants from Egypt ($50,901, a difference of 0.16%), Immigrants from Ukraine ($50,984, a difference of 0.33%), and Lithuanian ($50,991, a difference of 0.34%).
| Demographics | Rating | Rank | Median Earnings |
| Afghans | 99.9 /100 | #66 | Exceptional $51,112 |
| Immigrants | Spain | 99.9 /100 | #67 | Exceptional $51,092 |
| Paraguayans | 99.9 /100 | #68 | Exceptional $51,068 |
| Mongolians | 99.8 /100 | #69 | Exceptional $51,038 |
| Lithuanians | 99.8 /100 | #70 | Exceptional $50,991 |
| Immigrants | Ukraine | 99.8 /100 | #71 | Exceptional $50,984 |
| Immigrants | Egypt | 99.8 /100 | #72 | Exceptional $50,901 |
| Immigrants | Netherlands | 99.8 /100 | #73 | Exceptional $50,818 |
| South Africans | 99.8 /100 | #74 | Exceptional $50,752 |
| Immigrants | Scotland | 99.8 /100 | #75 | Exceptional $50,741 |
| Immigrants | Italy | 99.7 /100 | #76 | Exceptional $50,581 |
| Immigrants | Western Europe | 99.7 /100 | #77 | Exceptional $50,549 |
| Argentineans | 99.6 /100 | #78 | Exceptional $50,399 |
| Laotians | 99.6 /100 | #79 | Exceptional $50,343 |
| Ukrainians | 99.6 /100 | #80 | Exceptional $50,320 |