Immigrants from Liberia vs Basque Median Earnings
COMPARE
Immigrants from Liberia
Basque
Median Earnings
Median Earnings Comparison
Immigrants from Liberia
Basques
$42,923
MEDIAN EARNINGS
0.7/ 100
METRIC RATING
264th/ 347
METRIC RANK
$46,399
MEDIAN EARNINGS
48.8/ 100
METRIC RATING
175th/ 347
METRIC RANK
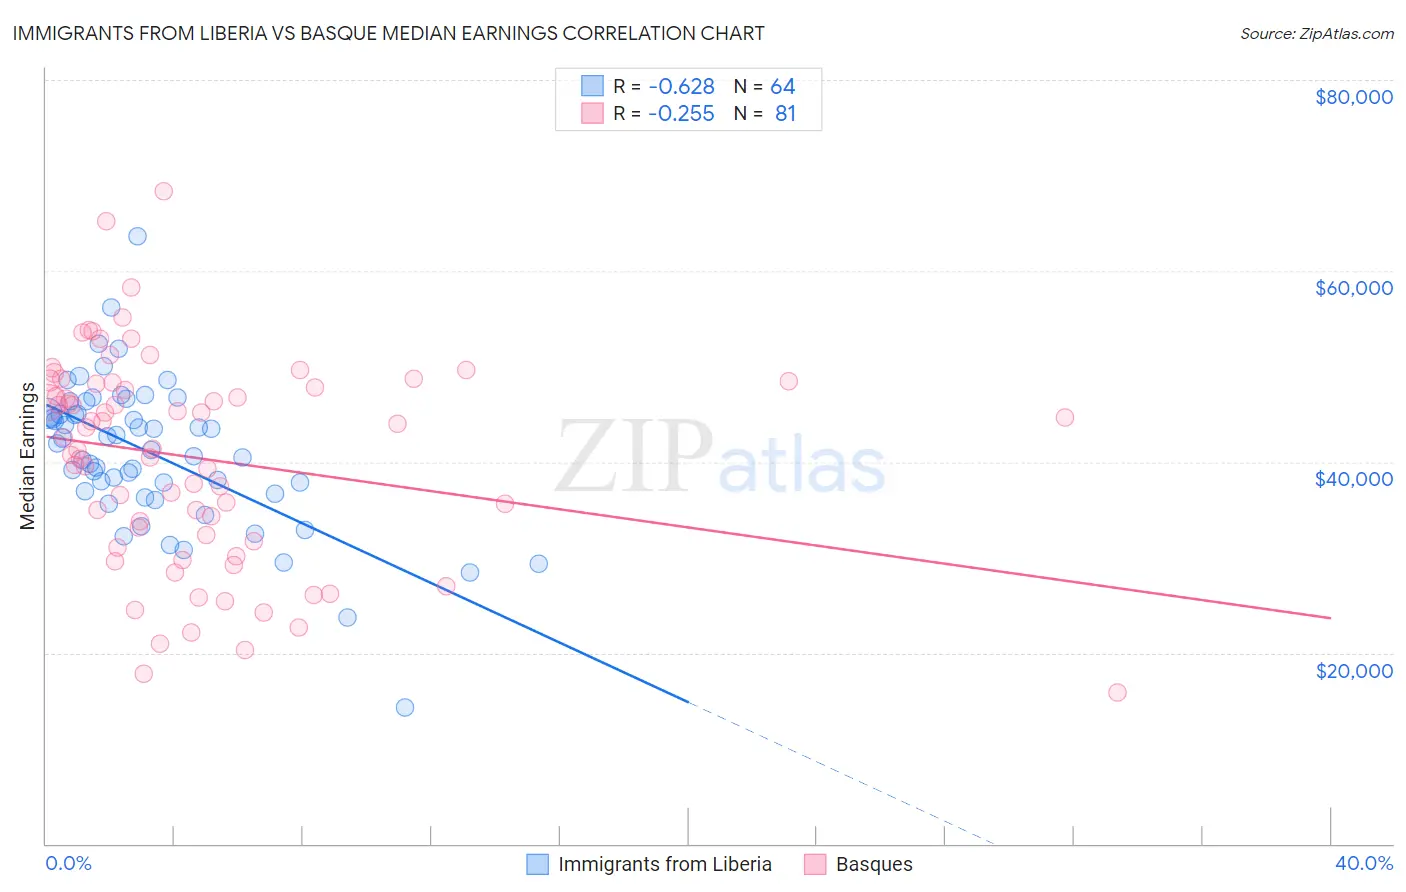
Immigrants from Liberia vs Basque Median Earnings Correlation Chart
The statistical analysis conducted on geographies consisting of 135,295,960 people shows a significant negative correlation between the proportion of Immigrants from Liberia and median earnings in the United States with a correlation coefficient (R) of -0.628 and weighted average of $42,923. Similarly, the statistical analysis conducted on geographies consisting of 165,772,846 people shows a weak negative correlation between the proportion of Basques and median earnings in the United States with a correlation coefficient (R) of -0.255 and weighted average of $46,399, a difference of 8.1%.
Median Earnings Correlation Summary
| Measurement | Immigrants from Liberia | Basque |
| Minimum | $14,336 | $15,833 |
| Maximum | $63,608 | $68,304 |
| Range | $49,272 | $52,471 |
| Mean | $40,857 | $40,382 |
| Median | $41,575 | $42,566 |
| Interquartile 25% (IQ1) | $36,787 | $32,007 |
| Interquartile 75% (IQ3) | $45,056 | $48,221 |
| Interquartile Range (IQR) | $8,269 | $16,214 |
| Standard Deviation (Sample) | $7,722 | $10,903 |
| Standard Deviation (Population) | $7,661 | $10,835 |
Similar Demographics by Median Earnings
Demographics Similar to Immigrants from Liberia by Median Earnings
In terms of median earnings, the demographic groups most similar to Immigrants from Liberia are Salvadoran ($42,912, a difference of 0.030%), Immigrants from Laos ($42,884, a difference of 0.090%), Inupiat ($43,000, a difference of 0.18%), Immigrants from Jamaica ($43,026, a difference of 0.24%), and Nicaraguan ($43,026, a difference of 0.24%).
| Demographics | Rating | Rank | Median Earnings |
| Jamaicans | 1.3 /100 | #257 | Tragic $43,343 |
| French American Indians | 1.3 /100 | #258 | Tragic $43,333 |
| German Russians | 1.1 /100 | #259 | Tragic $43,200 |
| Immigrants | Somalia | 0.9 /100 | #260 | Tragic $43,100 |
| Immigrants | Jamaica | 0.8 /100 | #261 | Tragic $43,026 |
| Nicaraguans | 0.8 /100 | #262 | Tragic $43,026 |
| Inupiat | 0.8 /100 | #263 | Tragic $43,000 |
| Immigrants | Liberia | 0.7 /100 | #264 | Tragic $42,923 |
| Salvadorans | 0.7 /100 | #265 | Tragic $42,912 |
| Immigrants | Laos | 0.7 /100 | #266 | Tragic $42,884 |
| Cree | 0.6 /100 | #267 | Tragic $42,777 |
| Americans | 0.6 /100 | #268 | Tragic $42,742 |
| Belizeans | 0.5 /100 | #269 | Tragic $42,702 |
| Osage | 0.5 /100 | #270 | Tragic $42,651 |
| Pennsylvania Germans | 0.5 /100 | #271 | Tragic $42,615 |
Demographics Similar to Basques by Median Earnings
In terms of median earnings, the demographic groups most similar to Basques are Danish ($46,392, a difference of 0.020%), Belgian ($46,375, a difference of 0.050%), Scandinavian ($46,433, a difference of 0.070%), Ghanaian ($46,440, a difference of 0.090%), and Colombian ($46,349, a difference of 0.11%).
| Demographics | Rating | Rank | Median Earnings |
| Immigrants | Africa | 54.6 /100 | #168 | Average $46,564 |
| Immigrants | South America | 54.0 /100 | #169 | Average $46,548 |
| Immigrants | Immigrants | 51.6 /100 | #170 | Average $46,478 |
| Scottish | 51.1 /100 | #171 | Average $46,463 |
| Kenyans | 51.0 /100 | #172 | Average $46,462 |
| Ghanaians | 50.3 /100 | #173 | Average $46,440 |
| Scandinavians | 50.0 /100 | #174 | Average $46,433 |
| Basques | 48.8 /100 | #175 | Average $46,399 |
| Danes | 48.6 /100 | #176 | Average $46,392 |
| Belgians | 48.0 /100 | #177 | Average $46,375 |
| Colombians | 47.1 /100 | #178 | Average $46,349 |
| English | 46.5 /100 | #179 | Average $46,334 |
| Puget Sound Salish | 46.5 /100 | #180 | Average $46,333 |
| Immigrants | Cameroon | 46.4 /100 | #181 | Average $46,329 |
| Swiss | 45.9 /100 | #182 | Average $46,315 |