Immigrants from Liberia vs Native/Alaskan Median Earnings
COMPARE
Immigrants from Liberia
Native/Alaskan
Median Earnings
Median Earnings Comparison
Immigrants from Liberia
Natives/Alaskans
$42,923
MEDIAN EARNINGS
0.7/ 100
METRIC RATING
264th/ 347
METRIC RANK
$38,896
MEDIAN EARNINGS
0.0/ 100
METRIC RATING
335th/ 347
METRIC RANK
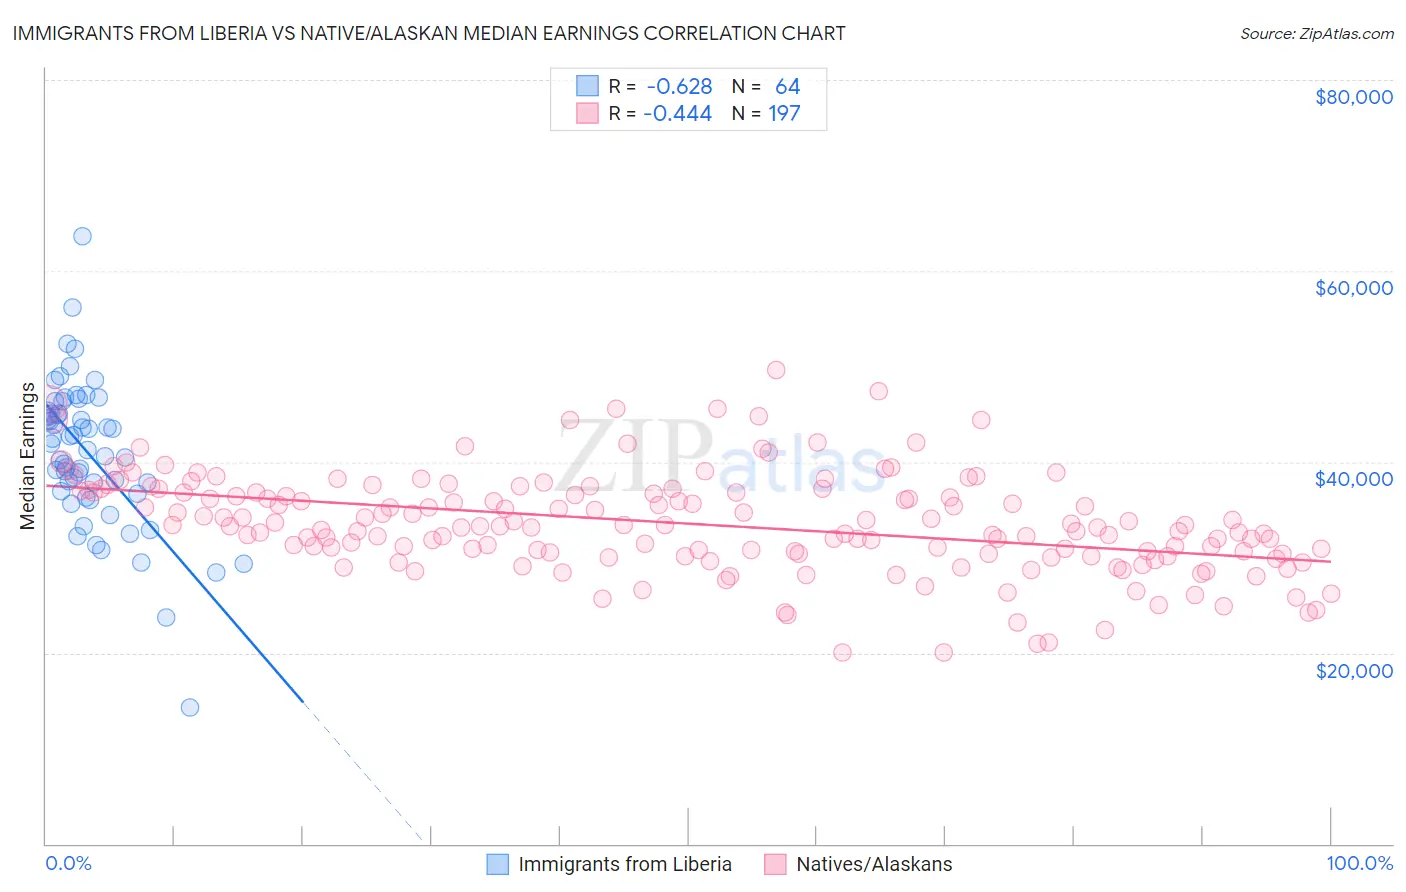
Immigrants from Liberia vs Native/Alaskan Median Earnings Correlation Chart
The statistical analysis conducted on geographies consisting of 135,295,960 people shows a significant negative correlation between the proportion of Immigrants from Liberia and median earnings in the United States with a correlation coefficient (R) of -0.628 and weighted average of $42,923. Similarly, the statistical analysis conducted on geographies consisting of 512,831,083 people shows a moderate negative correlation between the proportion of Natives/Alaskans and median earnings in the United States with a correlation coefficient (R) of -0.444 and weighted average of $38,896, a difference of 10.3%.
Median Earnings Correlation Summary
| Measurement | Immigrants from Liberia | Native/Alaskan |
| Minimum | $14,336 | $20,036 |
| Maximum | $63,608 | $49,581 |
| Range | $49,272 | $29,544 |
| Mean | $40,857 | $33,526 |
| Median | $41,575 | $33,302 |
| Interquartile 25% (IQ1) | $36,787 | $30,416 |
| Interquartile 75% (IQ3) | $45,056 | $36,881 |
| Interquartile Range (IQR) | $8,269 | $6,465 |
| Standard Deviation (Sample) | $7,722 | $5,244 |
| Standard Deviation (Population) | $7,661 | $5,231 |
Similar Demographics by Median Earnings
Demographics Similar to Immigrants from Liberia by Median Earnings
In terms of median earnings, the demographic groups most similar to Immigrants from Liberia are Salvadoran ($42,912, a difference of 0.030%), Immigrants from Laos ($42,884, a difference of 0.090%), Inupiat ($43,000, a difference of 0.18%), Immigrants from Jamaica ($43,026, a difference of 0.24%), and Nicaraguan ($43,026, a difference of 0.24%).
| Demographics | Rating | Rank | Median Earnings |
| Jamaicans | 1.3 /100 | #257 | Tragic $43,343 |
| French American Indians | 1.3 /100 | #258 | Tragic $43,333 |
| German Russians | 1.1 /100 | #259 | Tragic $43,200 |
| Immigrants | Somalia | 0.9 /100 | #260 | Tragic $43,100 |
| Immigrants | Jamaica | 0.8 /100 | #261 | Tragic $43,026 |
| Nicaraguans | 0.8 /100 | #262 | Tragic $43,026 |
| Inupiat | 0.8 /100 | #263 | Tragic $43,000 |
| Immigrants | Liberia | 0.7 /100 | #264 | Tragic $42,923 |
| Salvadorans | 0.7 /100 | #265 | Tragic $42,912 |
| Immigrants | Laos | 0.7 /100 | #266 | Tragic $42,884 |
| Cree | 0.6 /100 | #267 | Tragic $42,777 |
| Americans | 0.6 /100 | #268 | Tragic $42,742 |
| Belizeans | 0.5 /100 | #269 | Tragic $42,702 |
| Osage | 0.5 /100 | #270 | Tragic $42,651 |
| Pennsylvania Germans | 0.5 /100 | #271 | Tragic $42,615 |
Demographics Similar to Natives/Alaskans by Median Earnings
In terms of median earnings, the demographic groups most similar to Natives/Alaskans are Spanish American Indian ($38,907, a difference of 0.030%), Houma ($38,949, a difference of 0.14%), Crow ($38,707, a difference of 0.49%), Yakama ($39,107, a difference of 0.54%), and Immigrants from Mexico ($39,114, a difference of 0.56%).
| Demographics | Rating | Rank | Median Earnings |
| Sioux | 0.0 /100 | #328 | Tragic $39,448 |
| Kiowa | 0.0 /100 | #329 | Tragic $39,232 |
| Immigrants | Congo | 0.0 /100 | #330 | Tragic $39,169 |
| Immigrants | Mexico | 0.0 /100 | #331 | Tragic $39,114 |
| Yakama | 0.0 /100 | #332 | Tragic $39,107 |
| Houma | 0.0 /100 | #333 | Tragic $38,949 |
| Spanish American Indians | 0.0 /100 | #334 | Tragic $38,907 |
| Natives/Alaskans | 0.0 /100 | #335 | Tragic $38,896 |
| Crow | 0.0 /100 | #336 | Tragic $38,707 |
| Immigrants | Cuba | 0.0 /100 | #337 | Tragic $38,426 |
| Pima | 0.0 /100 | #338 | Tragic $38,285 |
| Menominee | 0.0 /100 | #339 | Tragic $37,884 |
| Navajo | 0.0 /100 | #340 | Tragic $36,999 |
| Lumbee | 0.0 /100 | #341 | Tragic $36,876 |
| Hopi | 0.0 /100 | #342 | Tragic $36,871 |