Immigrants from Liberia vs Czech Female Poverty
COMPARE
Immigrants from Liberia
Czech
Female Poverty
Female Poverty Comparison
Immigrants from Liberia
Czechs
15.7%
FEMALE POVERTY
0.1/ 100
METRIC RATING
265th/ 347
METRIC RANK
11.9%
FEMALE POVERTY
99.2/ 100
METRIC RATING
41st/ 347
METRIC RANK
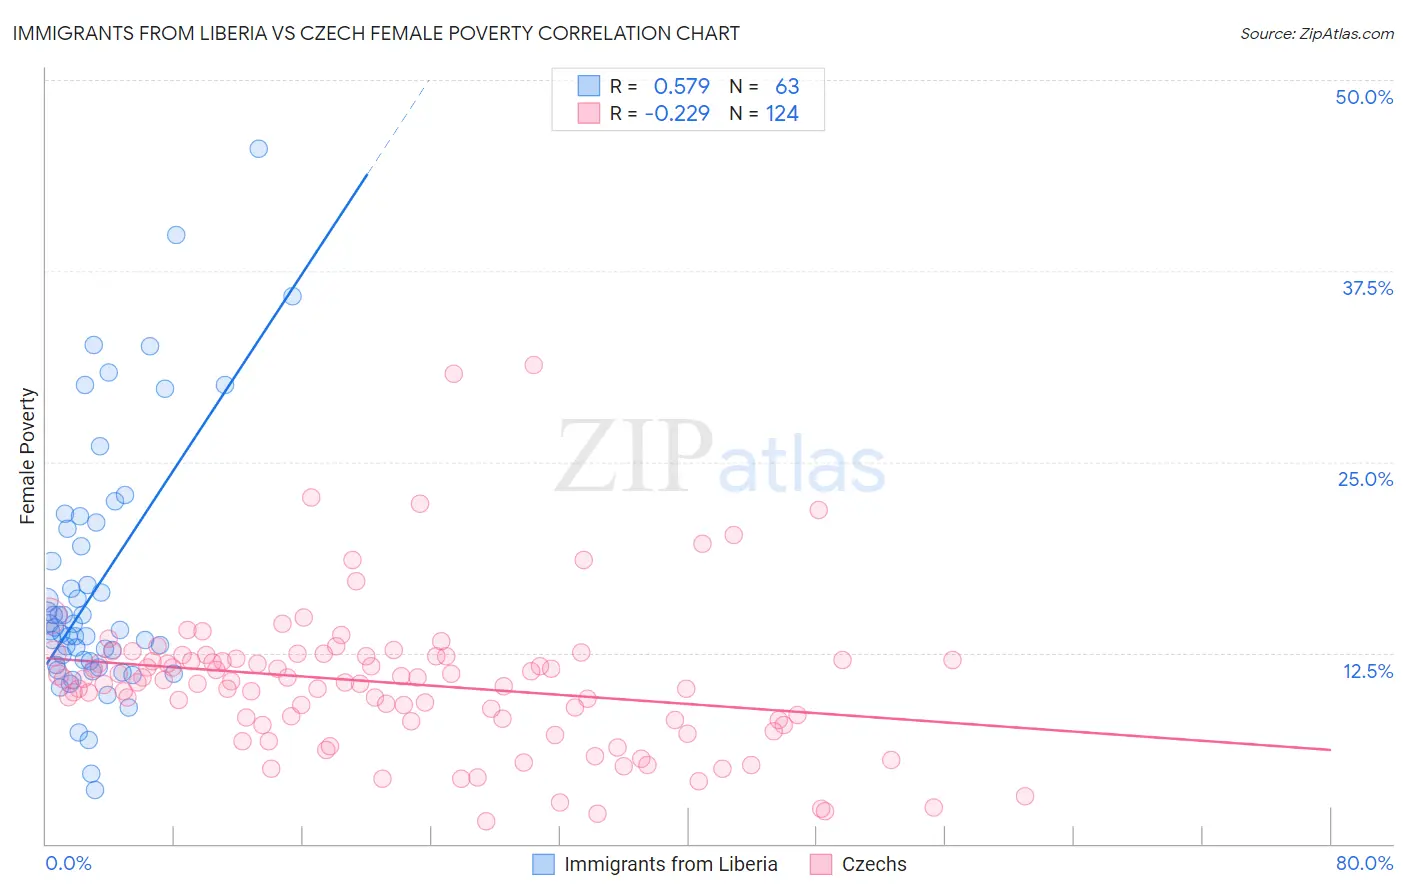
Immigrants from Liberia vs Czech Female Poverty Correlation Chart
The statistical analysis conducted on geographies consisting of 135,246,592 people shows a substantial positive correlation between the proportion of Immigrants from Liberia and poverty level among females in the United States with a correlation coefficient (R) of 0.579 and weighted average of 15.7%. Similarly, the statistical analysis conducted on geographies consisting of 484,224,691 people shows a weak negative correlation between the proportion of Czechs and poverty level among females in the United States with a correlation coefficient (R) of -0.229 and weighted average of 11.9%, a difference of 32.1%.
Female Poverty Correlation Summary
| Measurement | Immigrants from Liberia | Czech |
| Minimum | 3.5% | 1.4% |
| Maximum | 45.5% | 31.4% |
| Range | 42.0% | 29.9% |
| Mean | 16.9% | 10.5% |
| Median | 14.0% | 10.6% |
| Interquartile 25% (IQ1) | 11.7% | 8.0% |
| Interquartile 75% (IQ3) | 20.6% | 12.3% |
| Interquartile Range (IQR) | 8.9% | 4.2% |
| Standard Deviation (Sample) | 8.4% | 4.8% |
| Standard Deviation (Population) | 8.3% | 4.8% |
Similar Demographics by Female Poverty
Demographics Similar to Immigrants from Liberia by Female Poverty
In terms of female poverty, the demographic groups most similar to Immigrants from Liberia are Immigrants from El Salvador (15.7%, a difference of 0.060%), Immigrants from Ecuador (15.6%, a difference of 0.30%), Cherokee (15.6%, a difference of 0.42%), Mexican American Indian (15.6%, a difference of 0.43%), and Guyanese (15.6%, a difference of 0.44%).
| Demographics | Rating | Rank | Female Poverty |
| Shoshone | 0.1 /100 | #258 | Tragic 15.6% |
| Cape Verdeans | 0.1 /100 | #259 | Tragic 15.6% |
| Immigrants | Guyana | 0.1 /100 | #260 | Tragic 15.6% |
| Guyanese | 0.1 /100 | #261 | Tragic 15.6% |
| Mexican American Indians | 0.1 /100 | #262 | Tragic 15.6% |
| Cherokee | 0.1 /100 | #263 | Tragic 15.6% |
| Immigrants | Ecuador | 0.1 /100 | #264 | Tragic 15.6% |
| Immigrants | Liberia | 0.1 /100 | #265 | Tragic 15.7% |
| Immigrants | El Salvador | 0.1 /100 | #266 | Tragic 15.7% |
| Sub-Saharan Africans | 0.1 /100 | #267 | Tragic 15.8% |
| Immigrants | Nicaragua | 0.1 /100 | #268 | Tragic 15.8% |
| Iroquois | 0.1 /100 | #269 | Tragic 15.8% |
| Chickasaw | 0.1 /100 | #270 | Tragic 15.9% |
| Immigrants | St. Vincent and the Grenadines | 0.0 /100 | #271 | Tragic 15.9% |
| Belizeans | 0.0 /100 | #272 | Tragic 15.9% |
Demographics Similar to Czechs by Female Poverty
In terms of female poverty, the demographic groups most similar to Czechs are Immigrants from Moldova (11.9%, a difference of 0.0%), Korean (11.9%, a difference of 0.040%), Tongan (11.9%, a difference of 0.11%), Macedonian (11.8%, a difference of 0.18%), and Immigrants from Czechoslovakia (11.9%, a difference of 0.20%).
| Demographics | Rating | Rank | Female Poverty |
| Immigrants | Singapore | 99.4 /100 | #34 | Exceptional 11.8% |
| Immigrants | Iran | 99.4 /100 | #35 | Exceptional 11.8% |
| Immigrants | Pakistan | 99.4 /100 | #36 | Exceptional 11.8% |
| Immigrants | Greece | 99.3 /100 | #37 | Exceptional 11.8% |
| Russians | 99.3 /100 | #38 | Exceptional 11.8% |
| Immigrants | Poland | 99.3 /100 | #39 | Exceptional 11.8% |
| Macedonians | 99.3 /100 | #40 | Exceptional 11.8% |
| Czechs | 99.2 /100 | #41 | Exceptional 11.9% |
| Immigrants | Moldova | 99.2 /100 | #42 | Exceptional 11.9% |
| Koreans | 99.2 /100 | #43 | Exceptional 11.9% |
| Tongans | 99.2 /100 | #44 | Exceptional 11.9% |
| Immigrants | Czechoslovakia | 99.2 /100 | #45 | Exceptional 11.9% |
| Turks | 99.2 /100 | #46 | Exceptional 11.9% |
| Asians | 99.1 /100 | #47 | Exceptional 11.9% |
| Immigrants | Japan | 99.0 /100 | #48 | Exceptional 11.9% |