Immigrants from Liberia vs Iranian Median Earnings
COMPARE
Immigrants from Liberia
Iranian
Median Earnings
Median Earnings Comparison
Immigrants from Liberia
Iranians
$42,923
MEDIAN EARNINGS
0.7/ 100
METRIC RATING
264th/ 347
METRIC RANK
$58,474
MEDIAN EARNINGS
100.0/ 100
METRIC RATING
7th/ 347
METRIC RANK
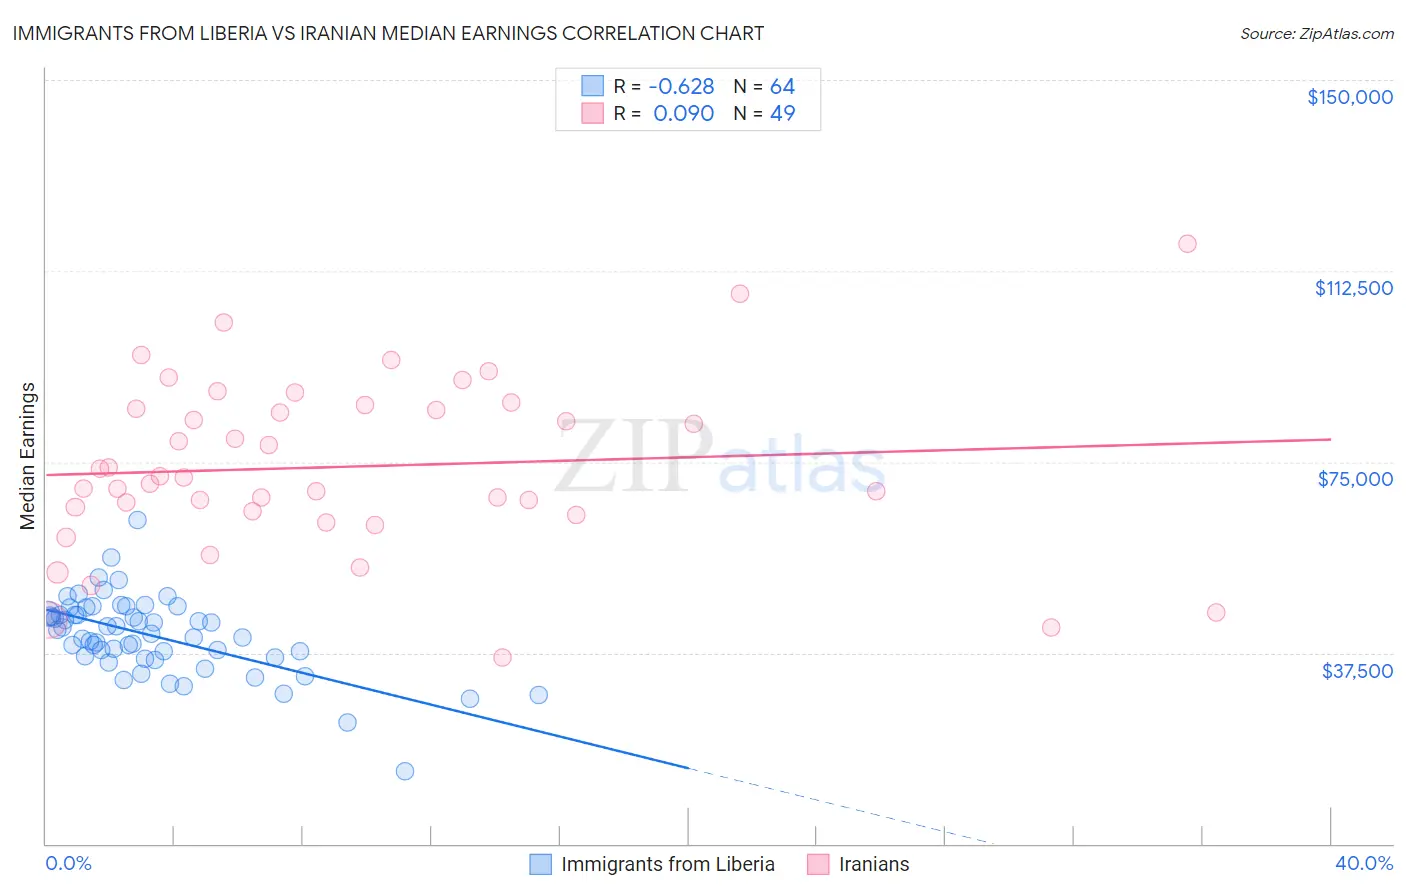
Immigrants from Liberia vs Iranian Median Earnings Correlation Chart
The statistical analysis conducted on geographies consisting of 135,295,960 people shows a significant negative correlation between the proportion of Immigrants from Liberia and median earnings in the United States with a correlation coefficient (R) of -0.628 and weighted average of $42,923. Similarly, the statistical analysis conducted on geographies consisting of 316,848,979 people shows a slight positive correlation between the proportion of Iranians and median earnings in the United States with a correlation coefficient (R) of 0.090 and weighted average of $58,474, a difference of 36.2%.
Median Earnings Correlation Summary
| Measurement | Immigrants from Liberia | Iranian |
| Minimum | $14,336 | $36,458 |
| Maximum | $63,608 | $117,883 |
| Range | $49,272 | $81,425 |
| Mean | $40,857 | $74,068 |
| Median | $41,575 | $72,050 |
| Interquartile 25% (IQ1) | $36,787 | $64,975 |
| Interquartile 75% (IQ3) | $45,056 | $85,806 |
| Interquartile Range (IQR) | $8,269 | $20,831 |
| Standard Deviation (Sample) | $7,722 | $17,049 |
| Standard Deviation (Population) | $7,661 | $16,874 |
Similar Demographics by Median Earnings
Demographics Similar to Immigrants from Liberia by Median Earnings
In terms of median earnings, the demographic groups most similar to Immigrants from Liberia are Salvadoran ($42,912, a difference of 0.030%), Immigrants from Laos ($42,884, a difference of 0.090%), Inupiat ($43,000, a difference of 0.18%), Immigrants from Jamaica ($43,026, a difference of 0.24%), and Nicaraguan ($43,026, a difference of 0.24%).
| Demographics | Rating | Rank | Median Earnings |
| Jamaicans | 1.3 /100 | #257 | Tragic $43,343 |
| French American Indians | 1.3 /100 | #258 | Tragic $43,333 |
| German Russians | 1.1 /100 | #259 | Tragic $43,200 |
| Immigrants | Somalia | 0.9 /100 | #260 | Tragic $43,100 |
| Immigrants | Jamaica | 0.8 /100 | #261 | Tragic $43,026 |
| Nicaraguans | 0.8 /100 | #262 | Tragic $43,026 |
| Inupiat | 0.8 /100 | #263 | Tragic $43,000 |
| Immigrants | Liberia | 0.7 /100 | #264 | Tragic $42,923 |
| Salvadorans | 0.7 /100 | #265 | Tragic $42,912 |
| Immigrants | Laos | 0.7 /100 | #266 | Tragic $42,884 |
| Cree | 0.6 /100 | #267 | Tragic $42,777 |
| Americans | 0.6 /100 | #268 | Tragic $42,742 |
| Belizeans | 0.5 /100 | #269 | Tragic $42,702 |
| Osage | 0.5 /100 | #270 | Tragic $42,651 |
| Pennsylvania Germans | 0.5 /100 | #271 | Tragic $42,615 |
Demographics Similar to Iranians by Median Earnings
In terms of median earnings, the demographic groups most similar to Iranians are Immigrants from Singapore ($59,038, a difference of 0.97%), Thai ($59,237, a difference of 1.3%), Immigrants from Iran ($57,612, a difference of 1.5%), Okinawan ($57,550, a difference of 1.6%), and Immigrants from Hong Kong ($59,433, a difference of 1.6%).
| Demographics | Rating | Rank | Median Earnings |
| Filipinos | 100.0 /100 | #1 | Exceptional $61,197 |
| Immigrants | Taiwan | 100.0 /100 | #2 | Exceptional $61,151 |
| Immigrants | India | 100.0 /100 | #3 | Exceptional $60,648 |
| Immigrants | Hong Kong | 100.0 /100 | #4 | Exceptional $59,433 |
| Thais | 100.0 /100 | #5 | Exceptional $59,237 |
| Immigrants | Singapore | 100.0 /100 | #6 | Exceptional $59,038 |
| Iranians | 100.0 /100 | #7 | Exceptional $58,474 |
| Immigrants | Iran | 100.0 /100 | #8 | Exceptional $57,612 |
| Okinawans | 100.0 /100 | #9 | Exceptional $57,550 |
| Immigrants | South Central Asia | 100.0 /100 | #10 | Exceptional $57,114 |
| Immigrants | Israel | 100.0 /100 | #11 | Exceptional $57,034 |
| Immigrants | Ireland | 100.0 /100 | #12 | Exceptional $56,854 |
| Immigrants | China | 100.0 /100 | #13 | Exceptional $56,638 |
| Immigrants | Australia | 100.0 /100 | #14 | Exceptional $56,305 |
| Indians (Asian) | 100.0 /100 | #15 | Exceptional $56,253 |